Automation Debugger
Courier’s automation debugging tool can be used to run a test event through your automation template and debug any errors you may come across.Creating a Test Run Context
Similar to notification templates, automations can now be tested with test run contexts passed in and saved as test events. These tests can mimic an incoming payload passed through Segment, inbound events, or an adhoc automation call. You can create a test event from theDebug tab in your automation template.
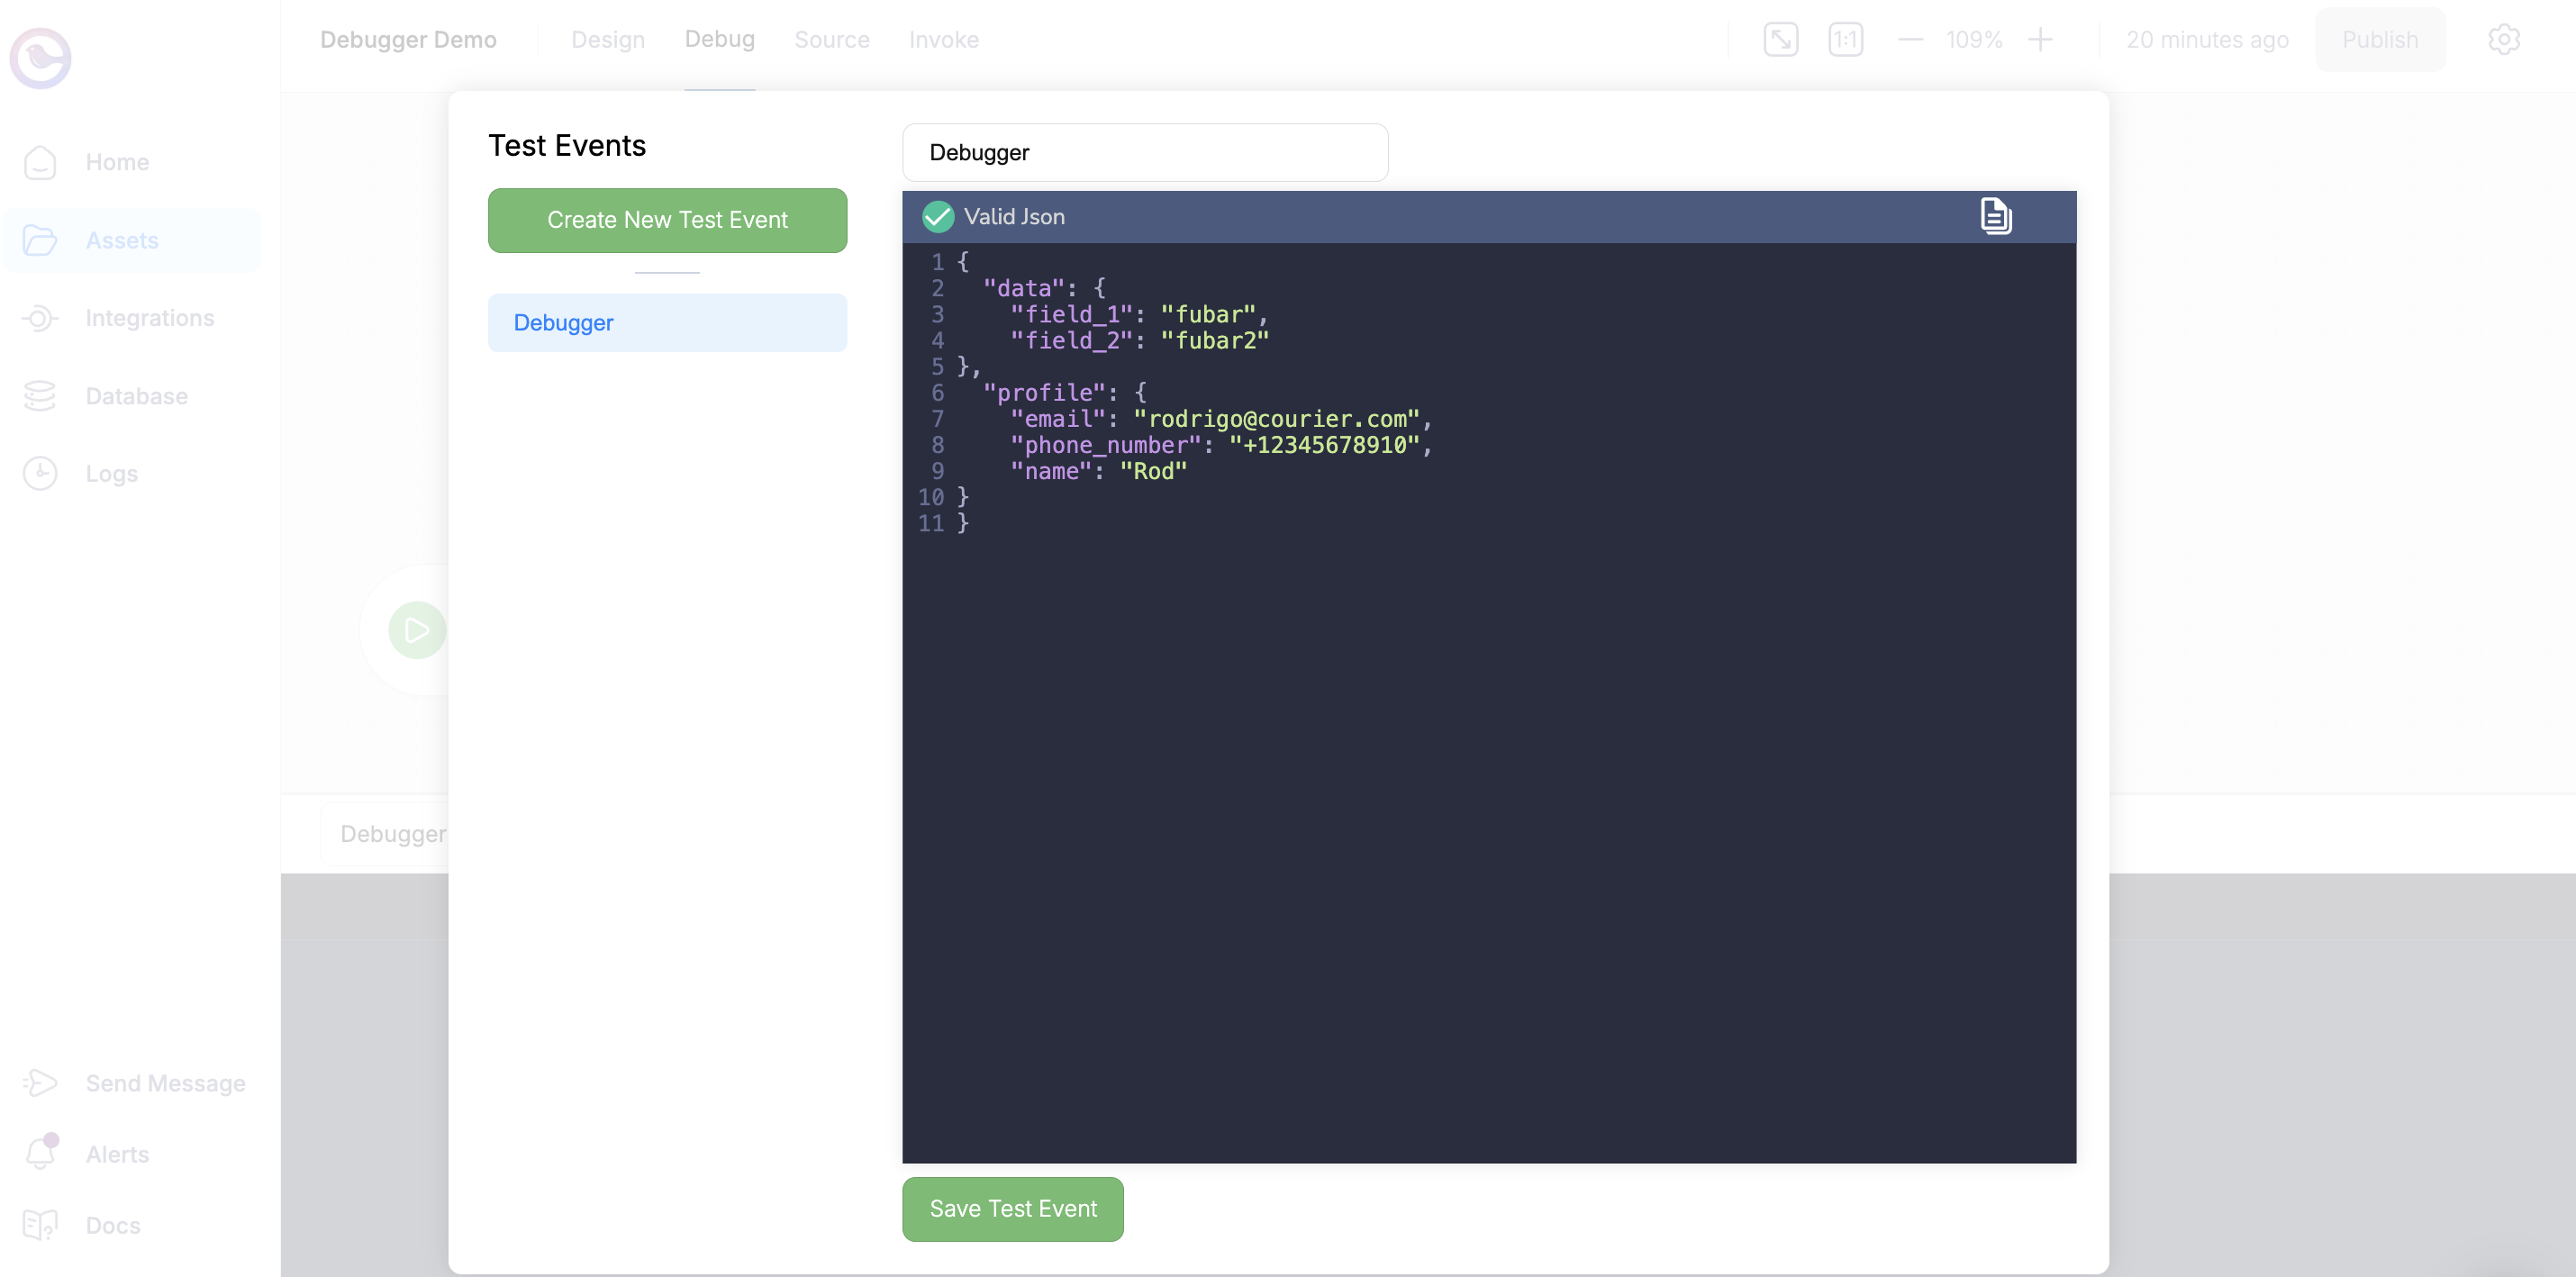
Running The Test Run Context
With your automation test event configured, you can execute a test run through the debugging tool to simulate the event passed through the automation workflow. When ready, click on theRun Again button and select each node to see the data being passed.
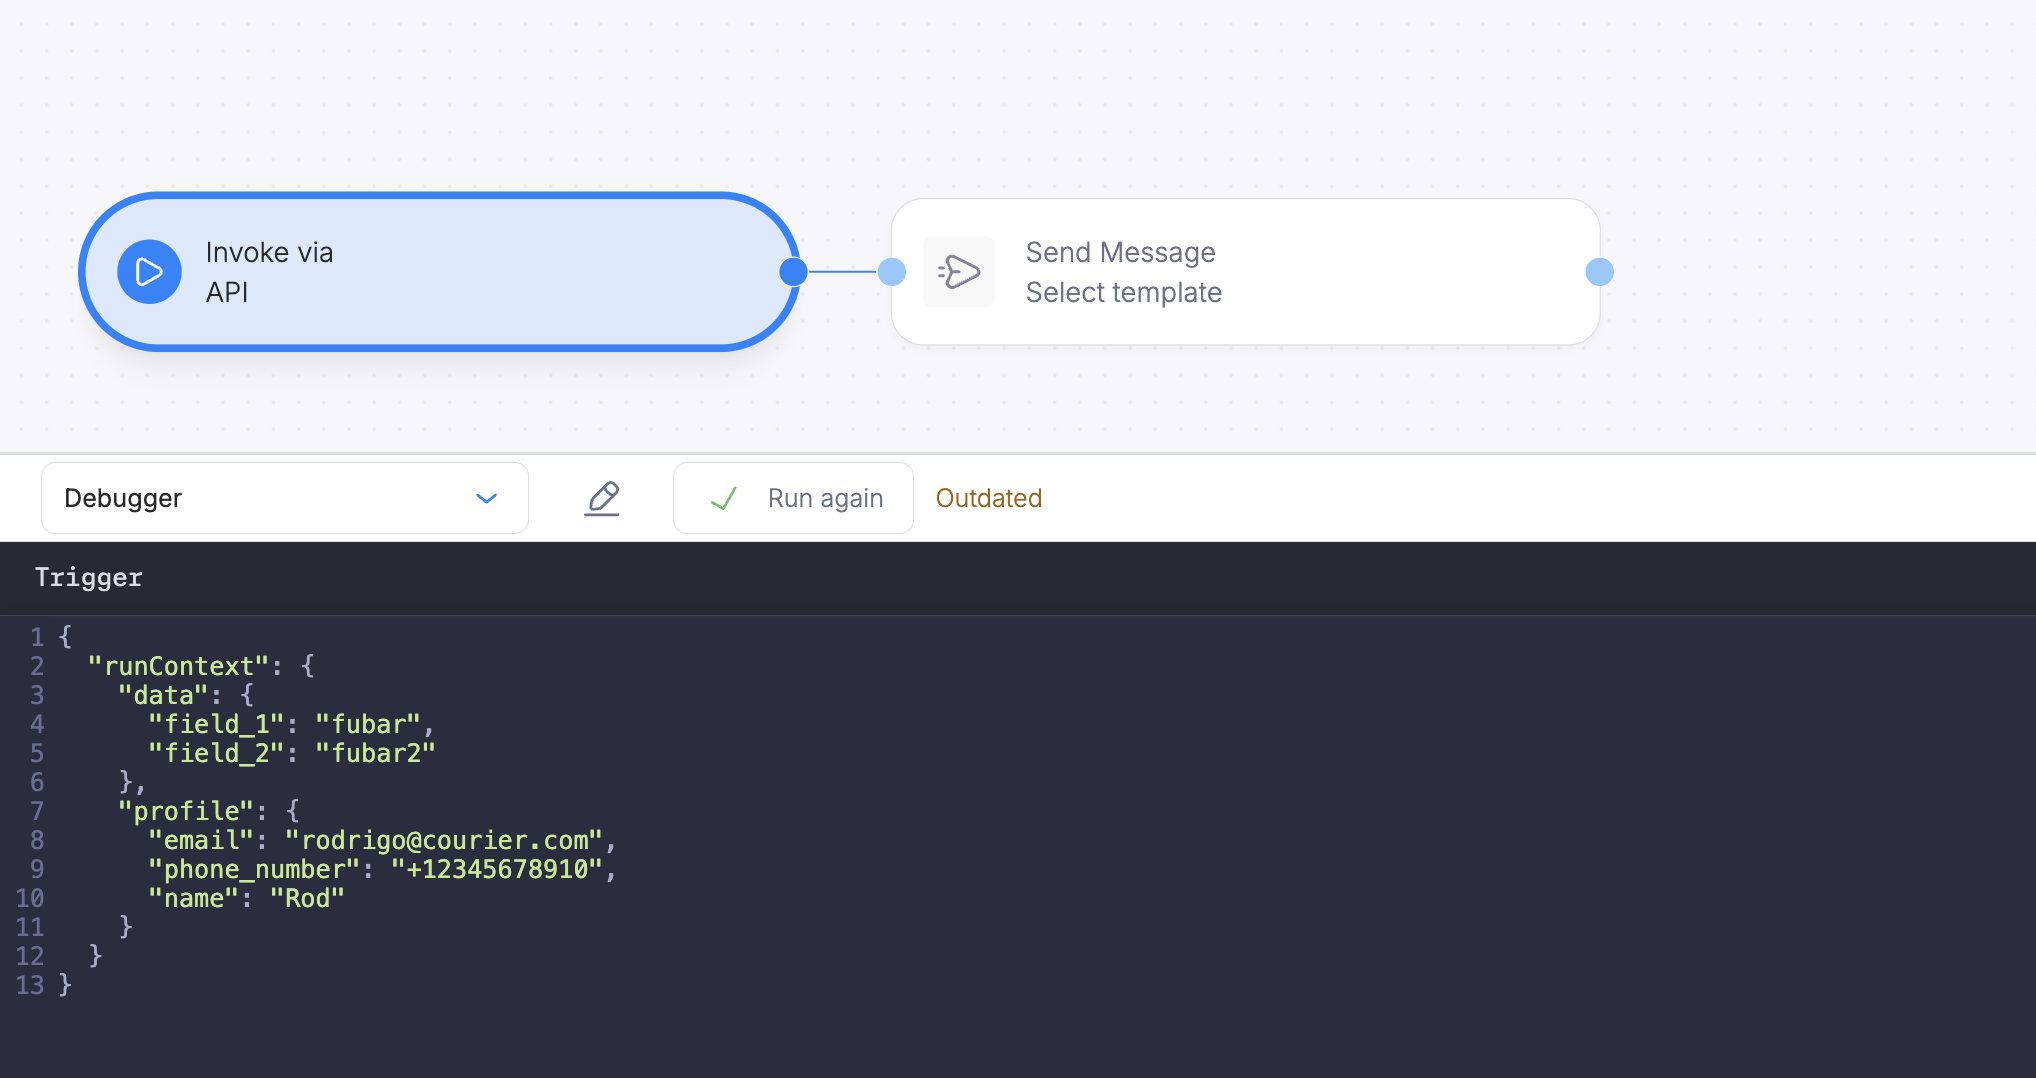
Verifying Test Data
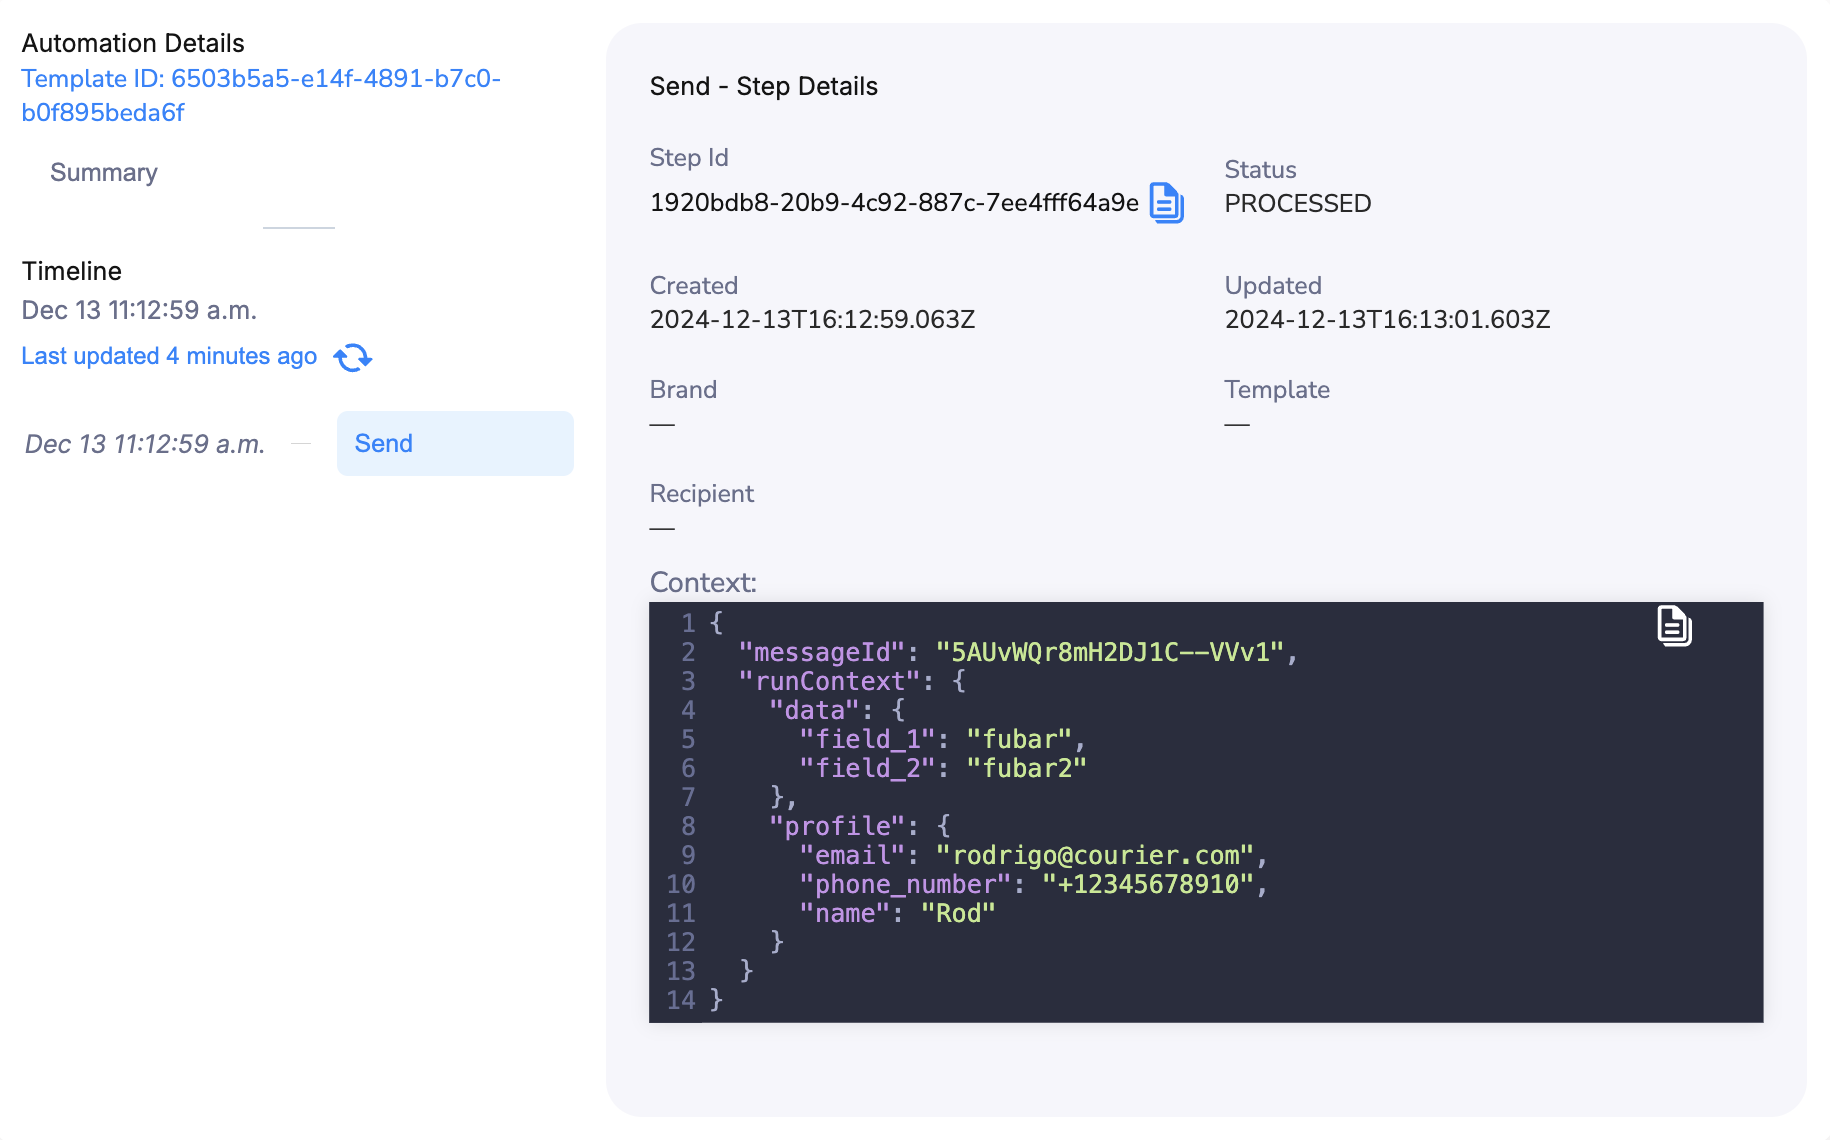
After running your simulated run, you can select each node in your workflow to verify that the data is passed through to each consecutive node. This can be helpful if you have several nodes that rely on incoming data payloads.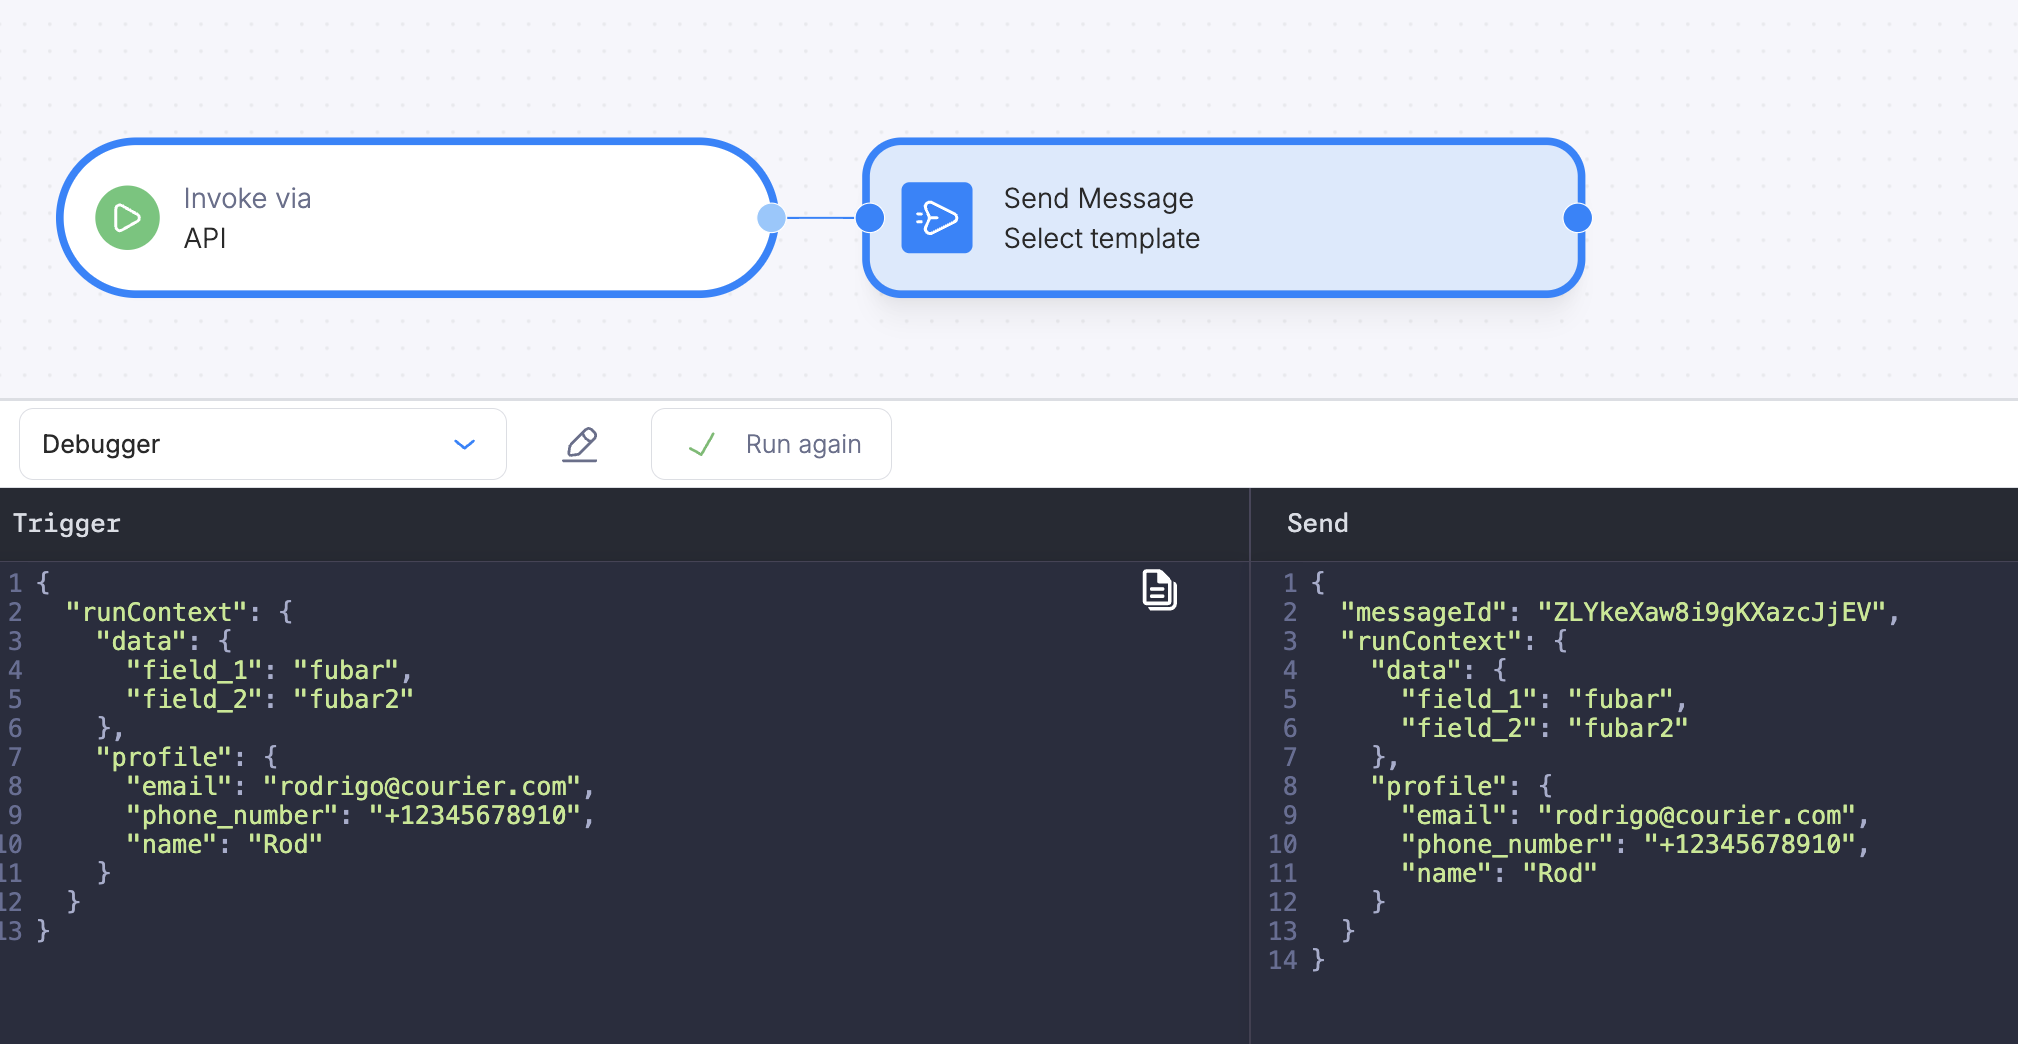
Run your Automation
After testing with the debugger, invoke your automation via API with the data payload you want to pass.POST https://api.courier.com/automations/:template_id/invoke
Testing GET Profile Nodes
Use the debugger to test a GET Profile node before promoting your template to production. The debugger shows the run context passed down your automation after fetching a profile.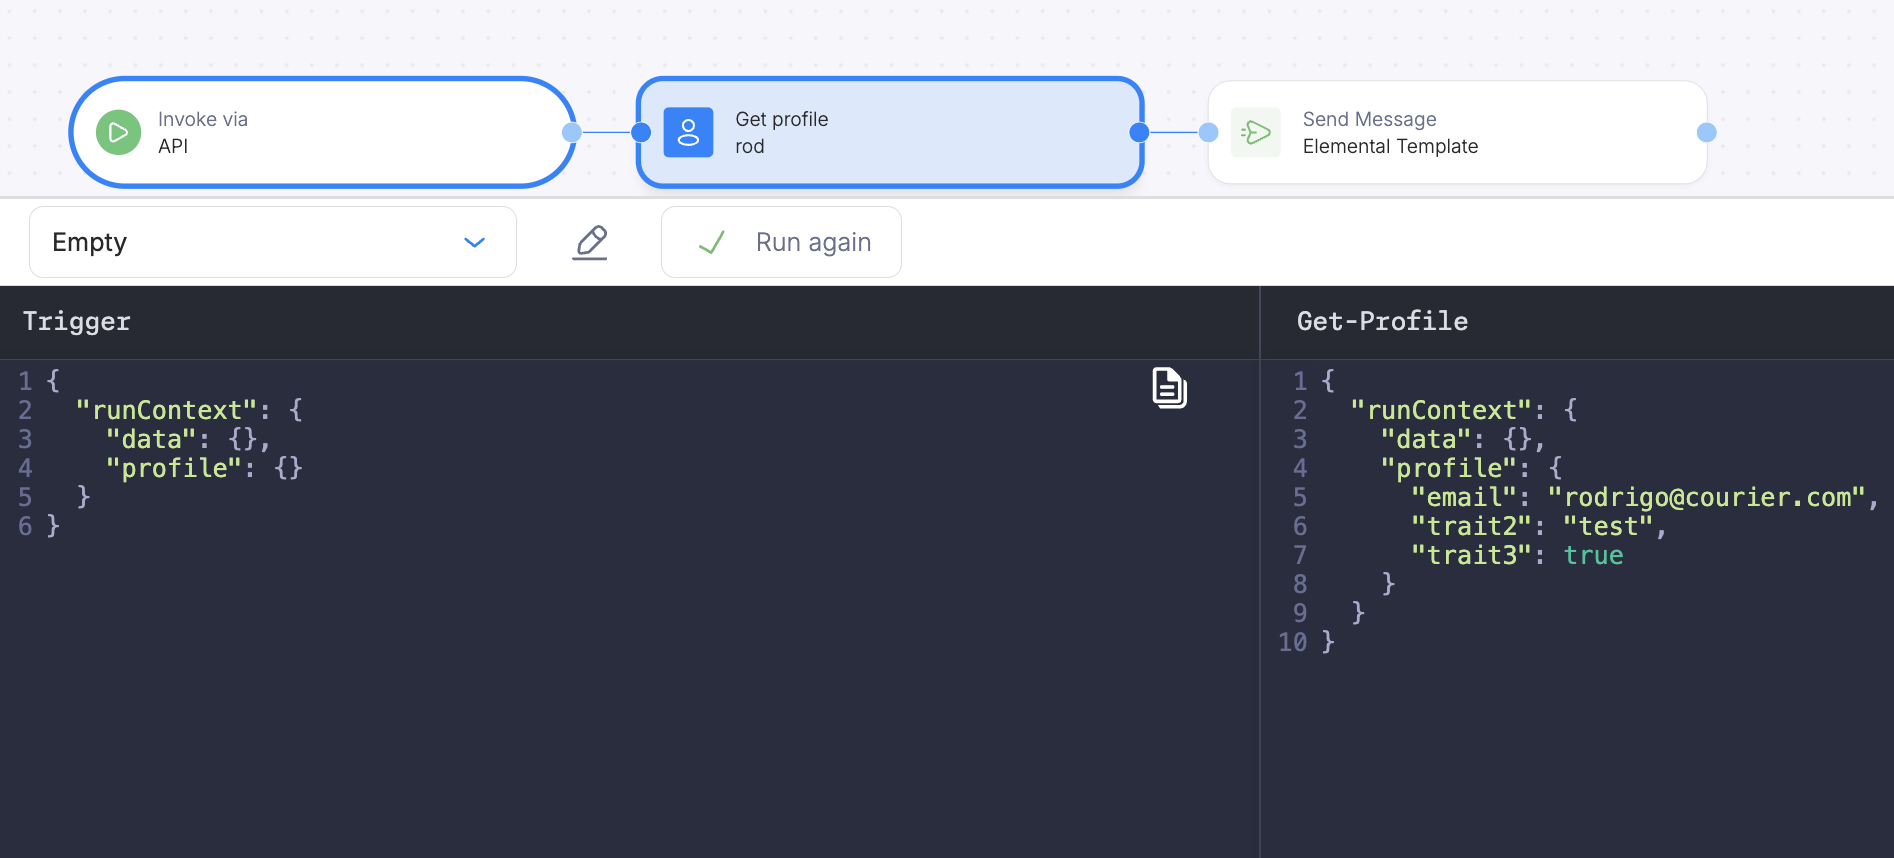
Related Resources
Automation Designer
Build workflows visually
Dynamic Data
Access and map data in automations