New Datadog integration for Courier notification logs and metrics
Robert Fenstermacher
April 11, 2023

The ability to unify all notification metrics and logs across channels and providers into an easy-to-use dashboard is a core advantage of Courier’s notification infrastructure.
However, with product notifications so critical to the entire application experience, it’s important to connect that data back to central cloud observability platforms that look across the entire stack. This gives platform engineering teams a complete understanding of application health and lets them quickly troubleshoot even the most complex issues.
Today, we’re incredibly excited to announce our first observability integration with Datadog.
Datadog is a tool for collecting metrics and other data from applications and viewing them in a centralized place. Datadog’s dashboards and monitoring tools build a more accurate picture of the health of your application and how it changes over time.
Our integration with Datadog is easy to spin up when you use our “dashboard starter kit.” This consists of some pre-configured JSON to set up a simple dashboard in Datadog for your Courier data.
Our Datadog integration is currently only available on Courier’s Business plan, much like our other production-focused features such as template analytics, Okta integration for SSO, and advanced user preferences.
The fastest way to pull your notification data into Datadog
Courier's message logs and analytics dashboard are optimized for helping product teams understand everything about the messaging use case — the status of notifications, recipients, lists, automations, and more. It brings all this data together across channels and providers in one place and provides the fastest way to learn about your notifications and troubleshoot notifications-related issues.
However, many organizations need to understand how notifications interact with the rest of the tech stack or would prefer to view and store all logs and metrics data in one place.
Until now, the only way to pull this data outside of Courier was to build your own bespoke solution, by listening to Courier’s outbound webhooks and writing custom code. But now the Datadog integration enables sending information about health and performance directly to your own monitoring system, which is much more convenient.
Use cases
Notification metrics and logs
The most obvious use cases involve sending data about the health and delivery status of your notifications. This could include metrics such as:
- Percentage of messages that are successfully sent, delivered, opened, and clicked.
- Delivery errors
- Percentage of customers who are unsubscribing from your messages
- Any metrics that measure outliers — for example, a metric that checks if you are sending either more or fewer messages than you should be.
- Number of people who opened your emails over time.
 (An example Datadog dashboard showing key notification health metrics, such as the number of emails and push notifications that are being sent over the course of the day)
 (Datadog graphs showing how many notifications are being opened and how many people are clicking on links. There are options to compare these metrics to other time periods such as the previous day, week, or quarter.)
Feature-specific metrics and logs
The integration also supports data from Courier platform features. This can provide even more color on how notifications support your business or operational goals. For example, If you use Courier Automations to build smart notification workflows, you may want to monitor how many times each automation has been invoked. Or, if you use Courier’s in-app notification Inbox, you might choose to monitor the number of connections to your Inbox and compare this to the number of active users on your site. A significant difference could indicate a problem that needs further investigation.For example, you might have released a change that broke your Inbox implementation through changes to an authentication method or a key.
 (Datadog graphs showing how many automations were invoked and the number of user profiles you created, modified, or deleted)
What data can be sent to Datadog from Courier?
Metrics
Courier metric names will have a courier.* prefix — for example, courier.notification.sent. A full list of all the Courier metrics that are available for you to send to Datadog is provided here. These metrics will be sent with additional information, such as success or failure codes, and tags (including whether the metric is for your production or staging environment).
Once the metrics are being sent to Datadog, you can set up corresponding alerts in Datadog. For example, you could set up an alert that emails your engineers when the number of notification delivery errors reach a certain predefined threshold.
Logs
Courier always had the ability to record logs about notifications, recipients, lists, and automations. Now these can be sent to Datadog in the same way that metrics are sent.
Courier’s logs provide details about delivery failures, as well as other information that can be relevant when debugging. With these logs now in Datadog, you’ll now be able to easily correlate the logs to your metrics, helping you debug any issues.
Setting up the Datadog integration
To set up this integration all you need is your Datadog API key and URL. From there, simply follow the setup guide, which will cover the steps to connect Courier with Datadog and how to create a Courier-specific dashboard in Datadog. This is where you’ll find our “dashboard starter kit,” a JSON file that has everything you need to set up a Courier dashboard, including commonly used Courier metrics. You can easily customize the JSON to add or remove different metrics according to your needs.
Next steps
If you’re already on Courier’s Business plan, you can start sending metrics and logs to Datadog right away. Otherwise, you can request a demo, and we’ll walk you through this integration in more detail, along with the other features in the Business plan to see if it’s right for your use case.
The ability to access your metrics and logs in an observability platform like Datadog allows you to set up a dashboard that shows the data that’s most important to you. You can also create graphs that enable you to see at a glance if something’s not right, or even set up alerts based on message delivery failures. Whatever size your business is, some level of monitoring is necessary if you want to have control over your application.
If you’re a Datadog user who is interested in trying Courier’s full-featured notifications infrastructure, you can try it for free.
Similar resources

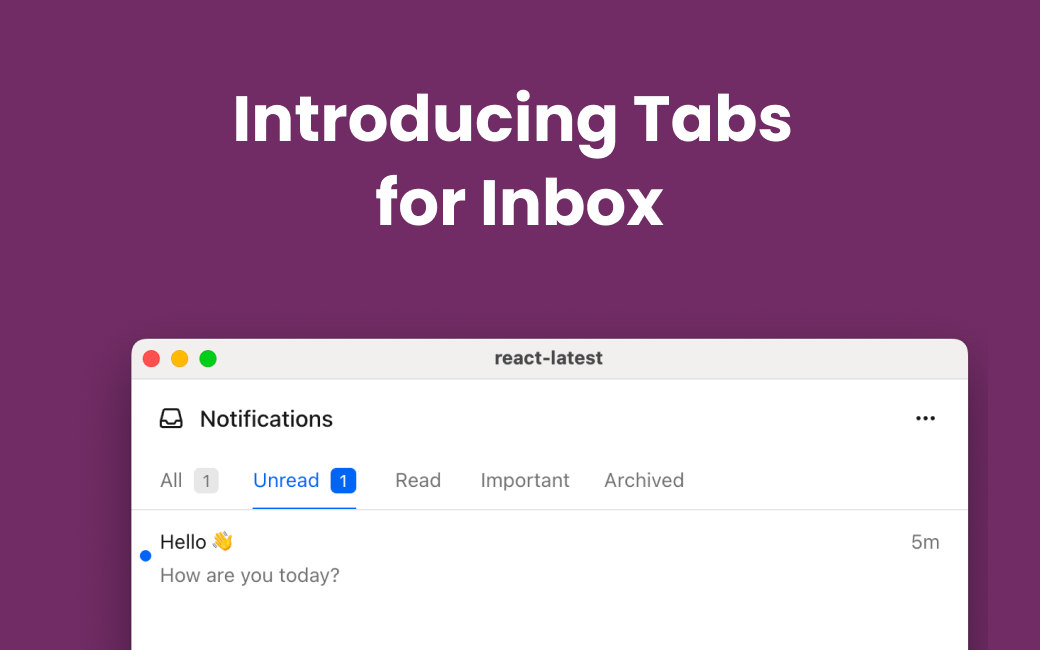
Help Users Navigate In-App Notifications Faster with Tabs in Courier Inbox
As your product grows, notifications pile up fast—and a single “everything” list turns into noise. Tabs for Courier Inbox let you organize in-app notifications into focused views (like Comments, Mentions, or Reactions) so users can find what they need faster, without you building custom filtering UI.
By Mike Miller
January 08, 2026

Your Notifications Now Have Two Audiences: Humans and AI Agents
AI agents are now filtering, summarizing, and acting on notifications before users ever see them. In late 2024, Anthropic released the Model Context Protocol. By mid-2025, MCP had become the connective tissue for AI agents that take actions on behalf of users. Google followed with A2A. Agentic browsers like Perplexity Comet and Opera Neon started treating the web as something to navigate programmatically. Your notification strategy needs to account for machine interpretation, not just human attention.
By Kyle Seyler
January 05, 2026

How to Use WhatsApp Typing Indicators on Twilio (Public Beta Guide)
Twilio now supports typing indicators for WhatsApp. When your backend takes a few seconds to generate a response, you can show users that something's happening instead of leaving them staring at a silent chat. The indicator appears when you call the new /v2/Indicators/Typing endpoint, automatically marks the message as read, and disappears after your response arrives or 25 seconds pass. This guide covers the API details, implementation patterns for Node.js and Python, when to use typing indicators, and current beta limitations.
By Kyle Seyler
December 03, 2025
© 2026 Courier. All rights reserved.