Notification Observability with OpenTelemetry & Courier (plus Grafana Support)
Thomas Schiavone
March 09, 2026
Notification Observability with OpenTelemetry & Courier
Your notification data shouldn't live in a separate silo. Delivery rates, open rates, failure counts — you want that in the same place you monitor everything else.
Courier now exports logs and metrics over OpenTelemetry, so you can pull Courier data directly into your own observability stack — Grafana, Datadog, whatever you run — right alongside your application metrics.
Why notification observability matters
Notifications touch every part of your product: onboarding, transactional emails, security alerts, billing reminders. When they break, the blast radius is wide and the signal is weak. A failed SMS doesn't throw a 500. A queued email doesn't spike your latency chart. These failures are silent unless you're explicitly watching for them.
With OTel export, you can:
- Alert on delivery failure rates before users report them
- Spot provider degradation by comparing delivery metrics across channels
- Correlate notification issues with deploys — if delivery drops right after a release, you know where to look
- Track automation health — know when a workflow stops firing, not when someone notices the emails stopped
This isn't about dashboards for the sake of dashboards. It's about closing the gap where notification failures currently hide.
What is OpenTelemetry?
OpenTelemetry (OTel) is an open source, vendor-neutral standard for collecting and exporting telemetry data — metrics, logs, and traces. It's backed by the CNCF and supported by virtually every major observability platform including Grafana, Datadog, New Relic, and Honeycomb.
Before OTel, every platform had its own agent, its own SDK, its own format. If you switched providers, you rewired everything. OpenTelemetry fixes that with a single protocol — OTLP — that works everywhere. You instrument once, export anywhere.
For Courier, this means your notification telemetry isn't locked into a proprietary dashboard. It flows into whatever observability stack you already run, alongside your API metrics, database logs, and application traces.
How Courier's OpenTelemetry integration works
Courier speaks OTLP natively — no SDK, no code changes, no collector required for providers that accept OTLP directly. You configure it in the dashboard: pick your auth type (Basic or Bearer), paste your endpoint, and Courier starts exporting.
The full setup takes about two minutes. See the docs.
Sending OTel data to Grafana Cloud
Most of our users run Grafana, so let's make this concrete.
Grafana Cloud uses Basic auth for OTLP. Courier supports Basic auth natively, which means you connect directly — no collector, no proxy, no YAML config files.
The setup is three steps:
- Grab your Instance ID and OTLP endpoint from the Grafana Cloud portal
- Generate a Cloud API token with
metrics:writeandlogs:writescopes - Enter those as Basic auth credentials in Courier's OpenTelemetry integration
That's it. Metrics land in Mimir, logs land in Loki. You can query both from Grafana's Explore view within minutes.
Full Grafana Cloud walkthrough
What to monitor first
Once data is flowing, three things are worth setting up immediately:
Delivery failure rate. Create a time series panel tracking sent vs. delivered vs. failed. Set an alert for when the failure rate exceeds 5% over a 5-minute window. This is your early warning system.
Channel comparison. Split delivery metrics by channel — email, SMS, push, in-app. Provider outages usually hit one channel. If SMS delivery drops while email stays healthy, you know it's not your code.
Volume anomaly detection. Track total messages per hour. Alert if volume drops to zero for 15 minutes. A silent notification pipeline is almost always a bug — in your code, your automation config, or an upstream dependency.
Notifications deserve observability too
Notifications have been a black box for too long. You instrument your APIs. You monitor your databases. You trace your requests end to end. But the thing that actually talks to your users? That gets a log line and a prayer.
OpenTelemetry changes that. Your notification pipeline is now a first-class citizen in your observability stack.
Similar resources
AI Translation: localize any template in seconds
Courier AI Translation brings built-in localization to Design Studio. Add a language to any template and AI translates every string in seconds. Works across email, SMS, push, in-app, and chat. Review side by side, override anything, and publish from the same editor you already use.
By Thomas Schiavone
June 26, 2026
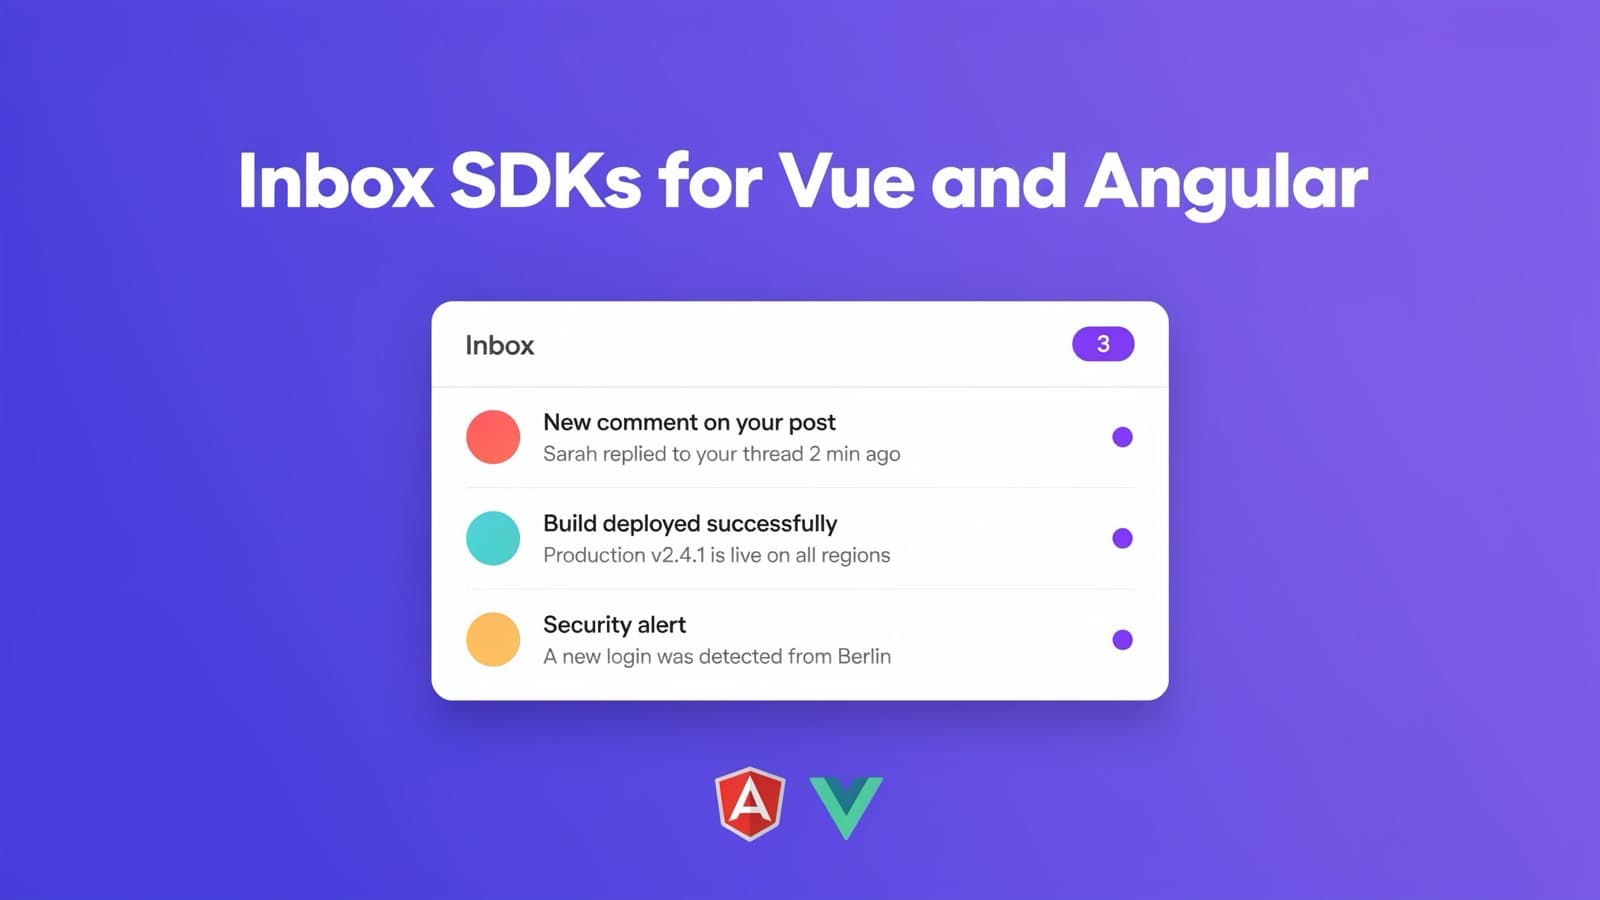
Inbox SDKs for Vue and Angular: a native in-app notification center
Courier now ships first-class inbox SDKs for Angular and Vue. Drop in a real-time notification center, toasts, and a preferences center with native components, an injectable service, and a composable, all backed by the same in-app inbox that already powers React and JavaScript apps.
By Mike Miller
June 19, 2026

What we shipped this month: May 2026 Edition
Courier shipped five launches in May 2026: AI Agent in Journeys (GA), the new Journeys API for code-driven flows, Custom Environments, Design Studio styling controls, and Courier Console v3. Each one closes a gap between writing software and shipping the messages that go with it.
By Kyle Seyler
May 20, 2026
© 2026 Courier. All rights reserved.