

How it works
The shows two views of the workspace:- Send volume chart, notification volume over time.
- Template performance table, total sends and error rates per template.
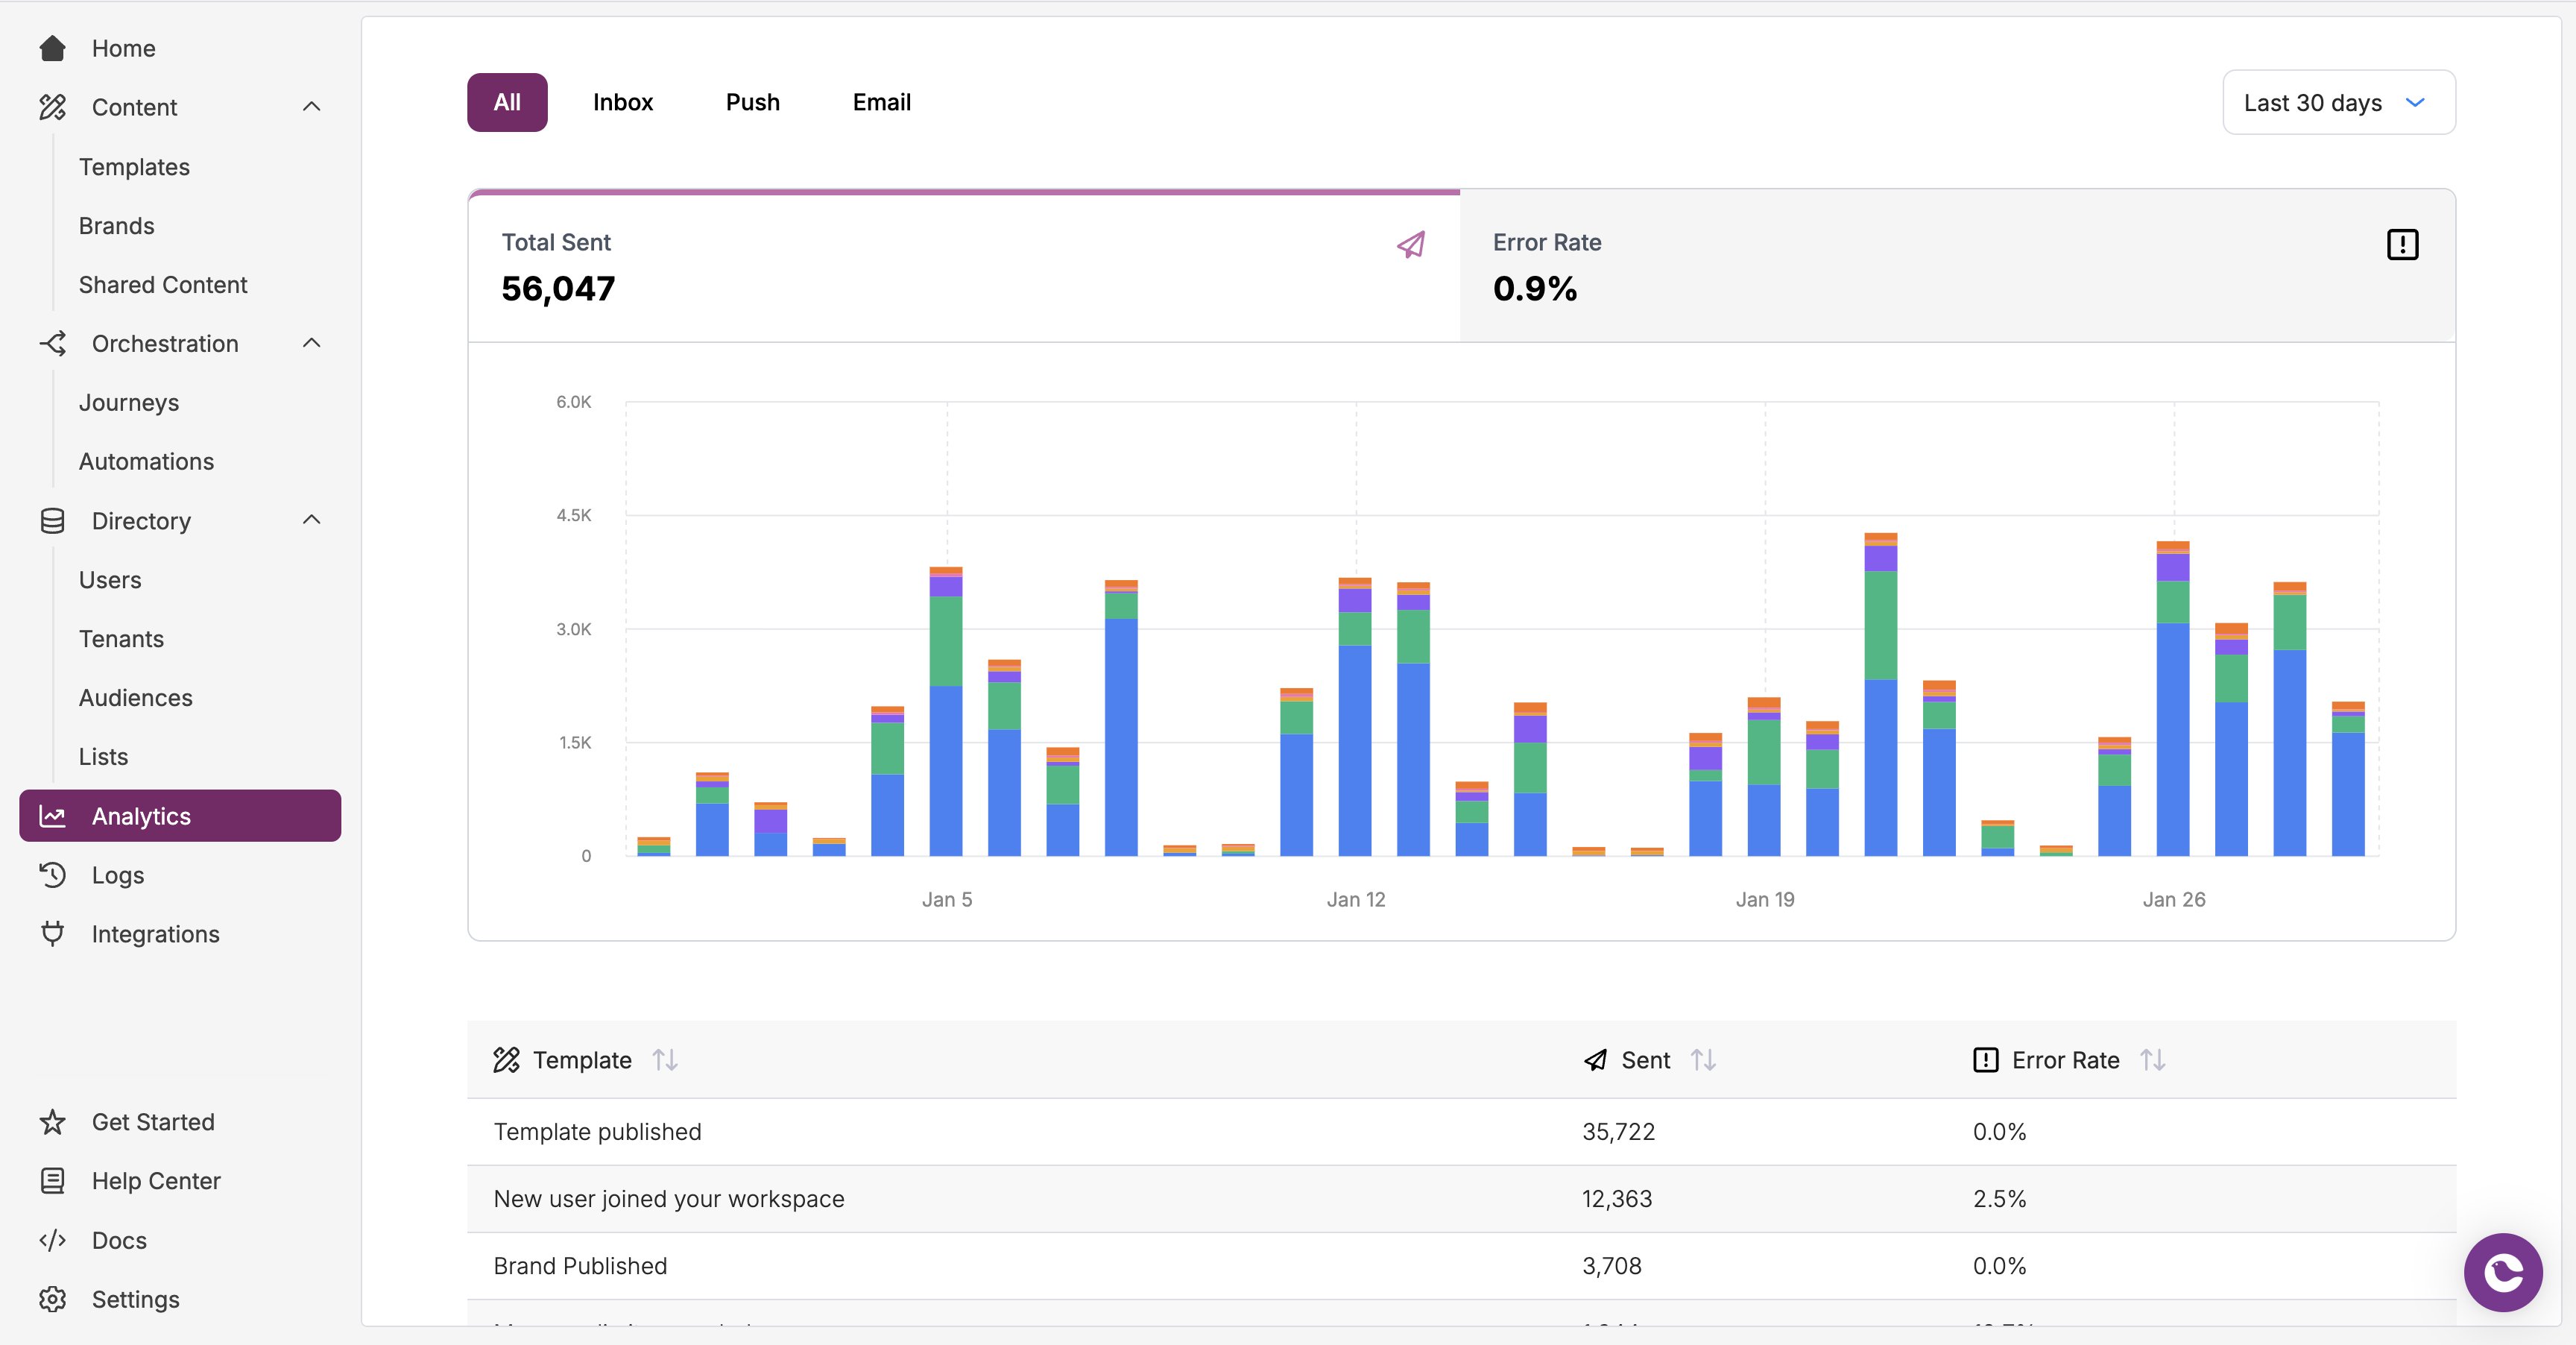
Pick a time range
One dropdown sets the window for both the chart and the table: Last 7 days, Last 30 days, Last 90 days, and Custom range. Custom range opens a two-month calendar. It reaches back to January 1 of last year, which is as far as the analytics store answers, so the calendar never offers a start date the chart would return empty. A window you cannot access is not just hidden from the dropdown. A range pasted into the URL is pulled back to the widest one available to you.What the metrics count
Opens and clicks come from Courier, not from the provider, so they only appear on channels Courier can track. In practice that means email for opens, and any channel with link tracking for clicks. A
0 on a channel without tracking means “not measured”, not “nobody read it”. See .
Per-template metrics
Drill into a template to see its metrics split by channel and provider. Use it to compare channels for one notification type, or to spot one provider carrying an unusually high error rate. The windows inside it follow the same limits as the page.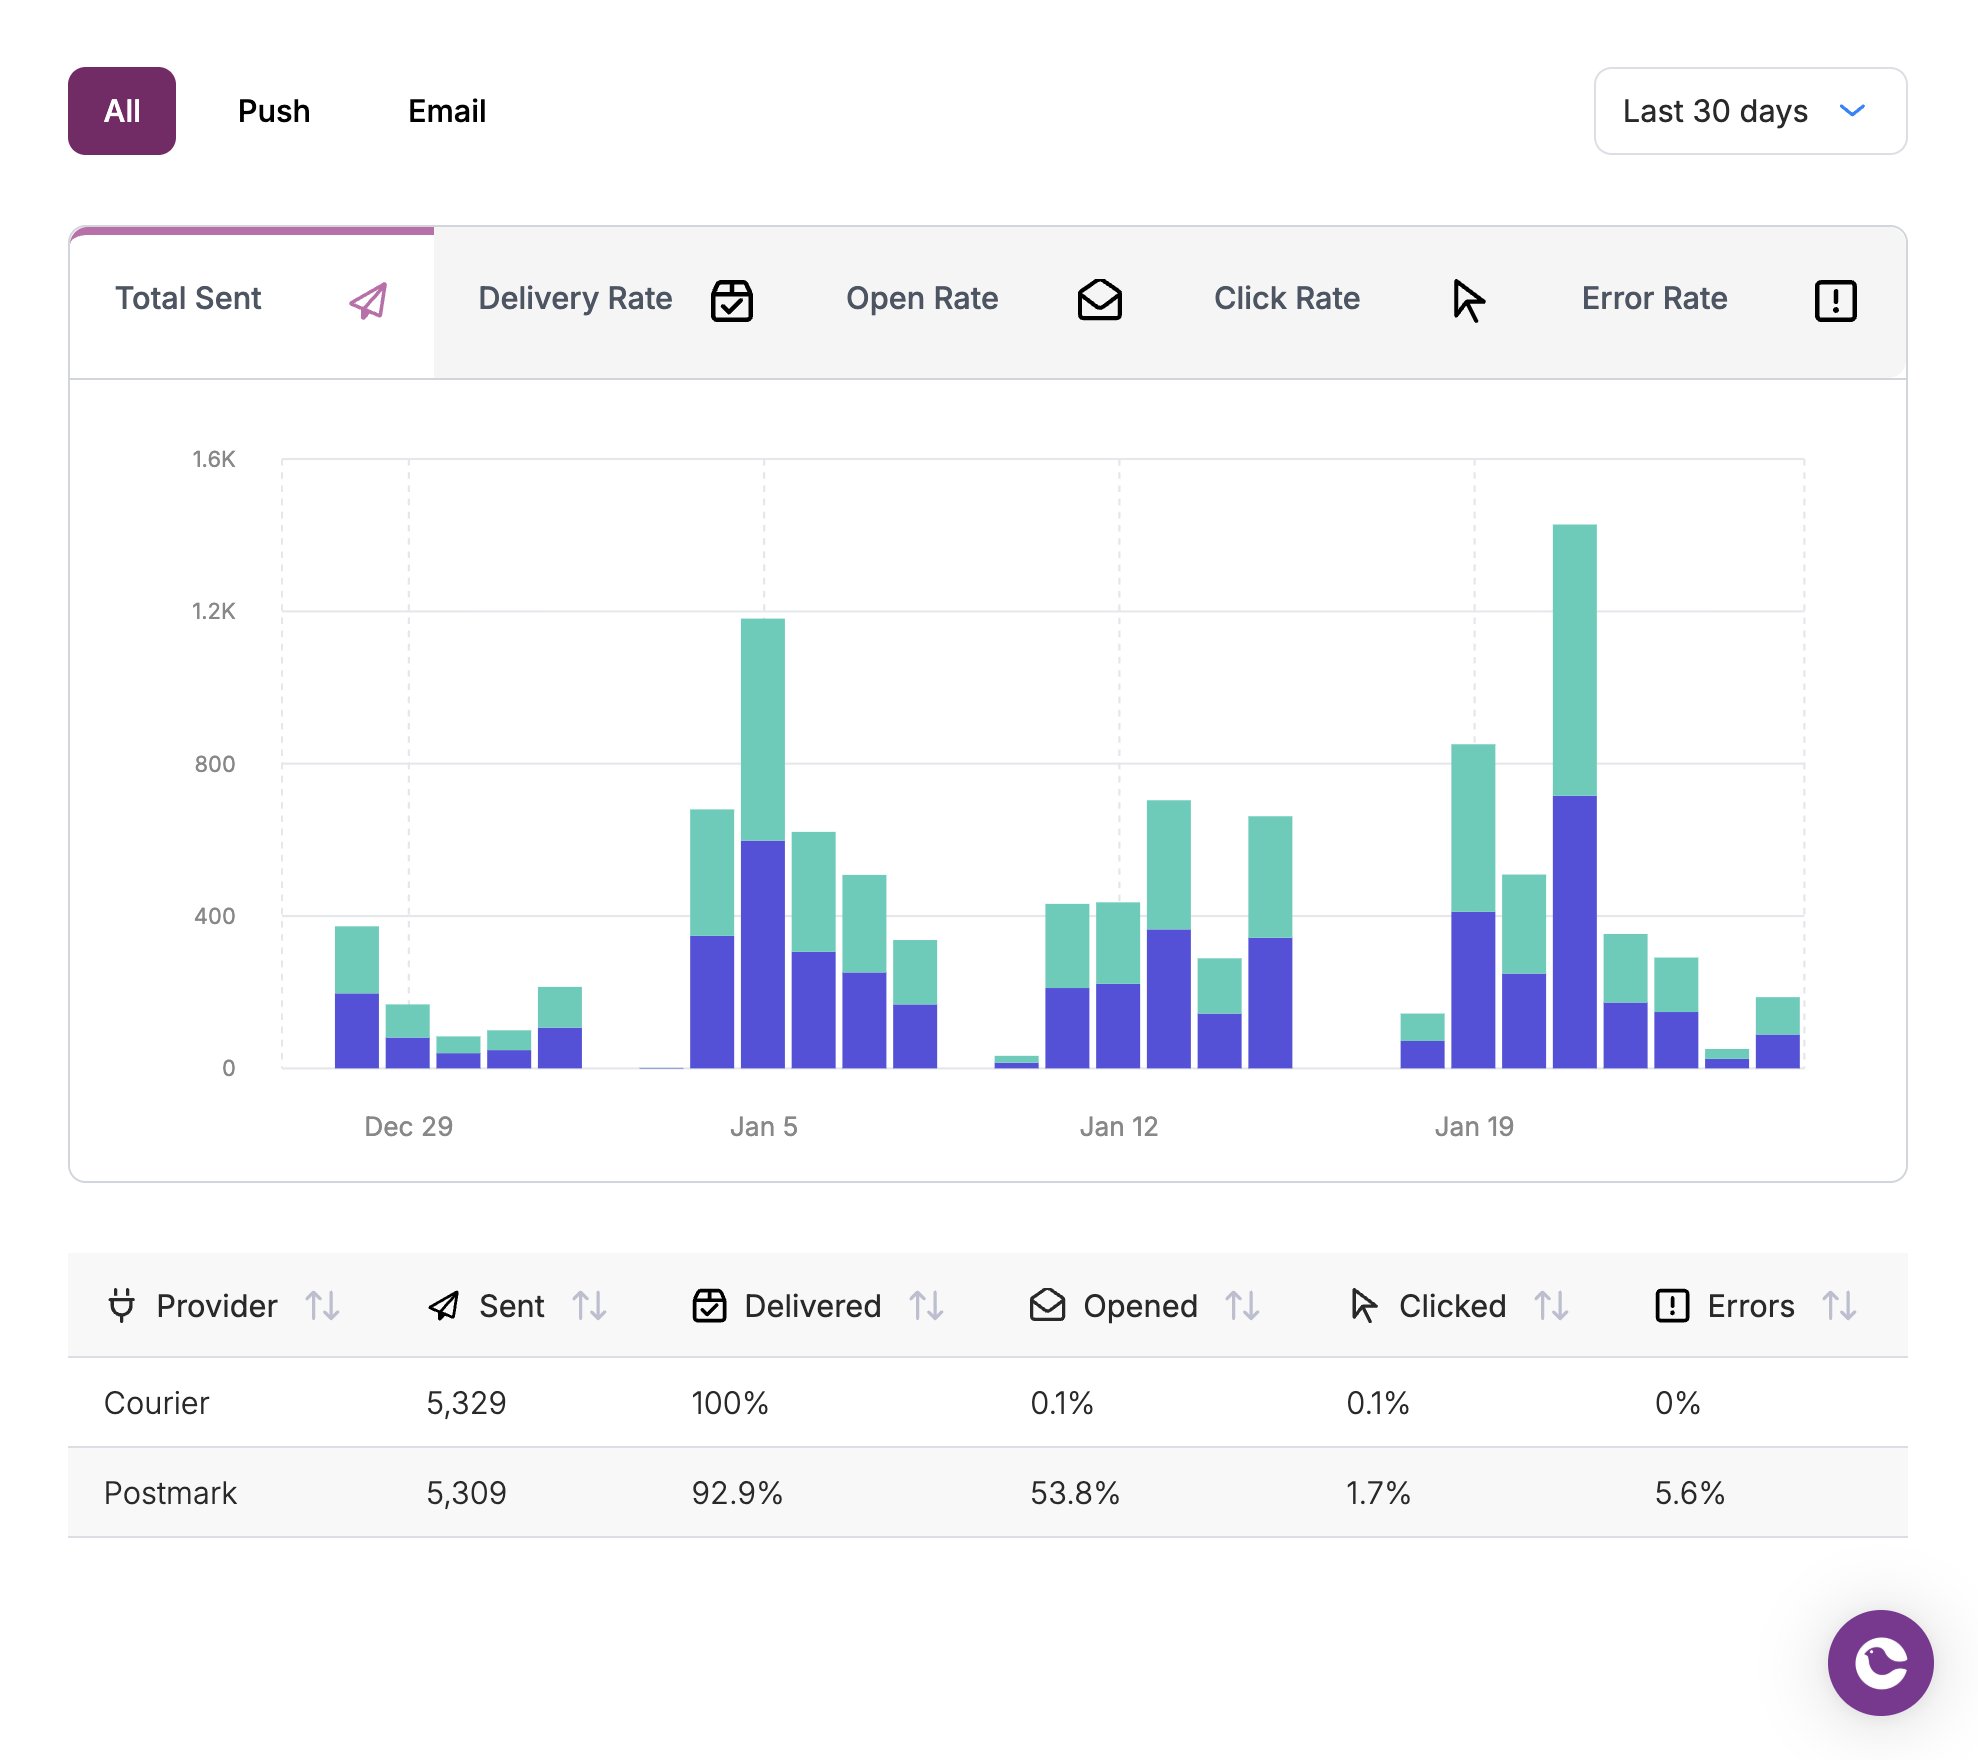
Why delivery rates read low
Delivered is the one metric Courier cannot produce on its own. The provider has to report back, and that reporting is off until you set it up, per provider. Until then a healthy send stops at SENT, and the delivery rate looks broken when nothing is wrong.
Which providers report, how each one reports, and what you have to configure are all in . Set it up there, then new sends start filling in the Delivered column here.
Limits & behavior
- Windows are UTC. A “last 7 days” figure covers 7 UTC days, which can differ from your local reporting day.
- Analytics are per template. There is no roll-up by tenant, list, or audience. For one send’s numbers, use .
- Sends without a template do not appear. A message sent with inline content has no template to attribute it to.
- Rates are only as complete as the tracking behind them. A provider that never confirms delivery depresses the delivery rate even though nothing is wrong. See .
FAQ
Why is my delivery rate lower than expected?
Why is my delivery rate lower than expected?
Delivery rate counts messages a provider confirmed. Some providers never confirm, and most need configuration first, so messages sit at
SENT. Set up for the providers you send with.Can I pull these numbers into my own dashboard?
Can I pull these numbers into my own dashboard?
returns one template’s funnel as a time series, bucketed by hour, day, week, or month and broken out per provider and channel. For a workspace-wide view, list your templates and call it for each one.
Why do my Test sends not show up?
Why do my Test sends not show up?
Analytics are scoped to the environment of the key that sent the message. Switch the console to the Test environment to see sends made with a Test key.