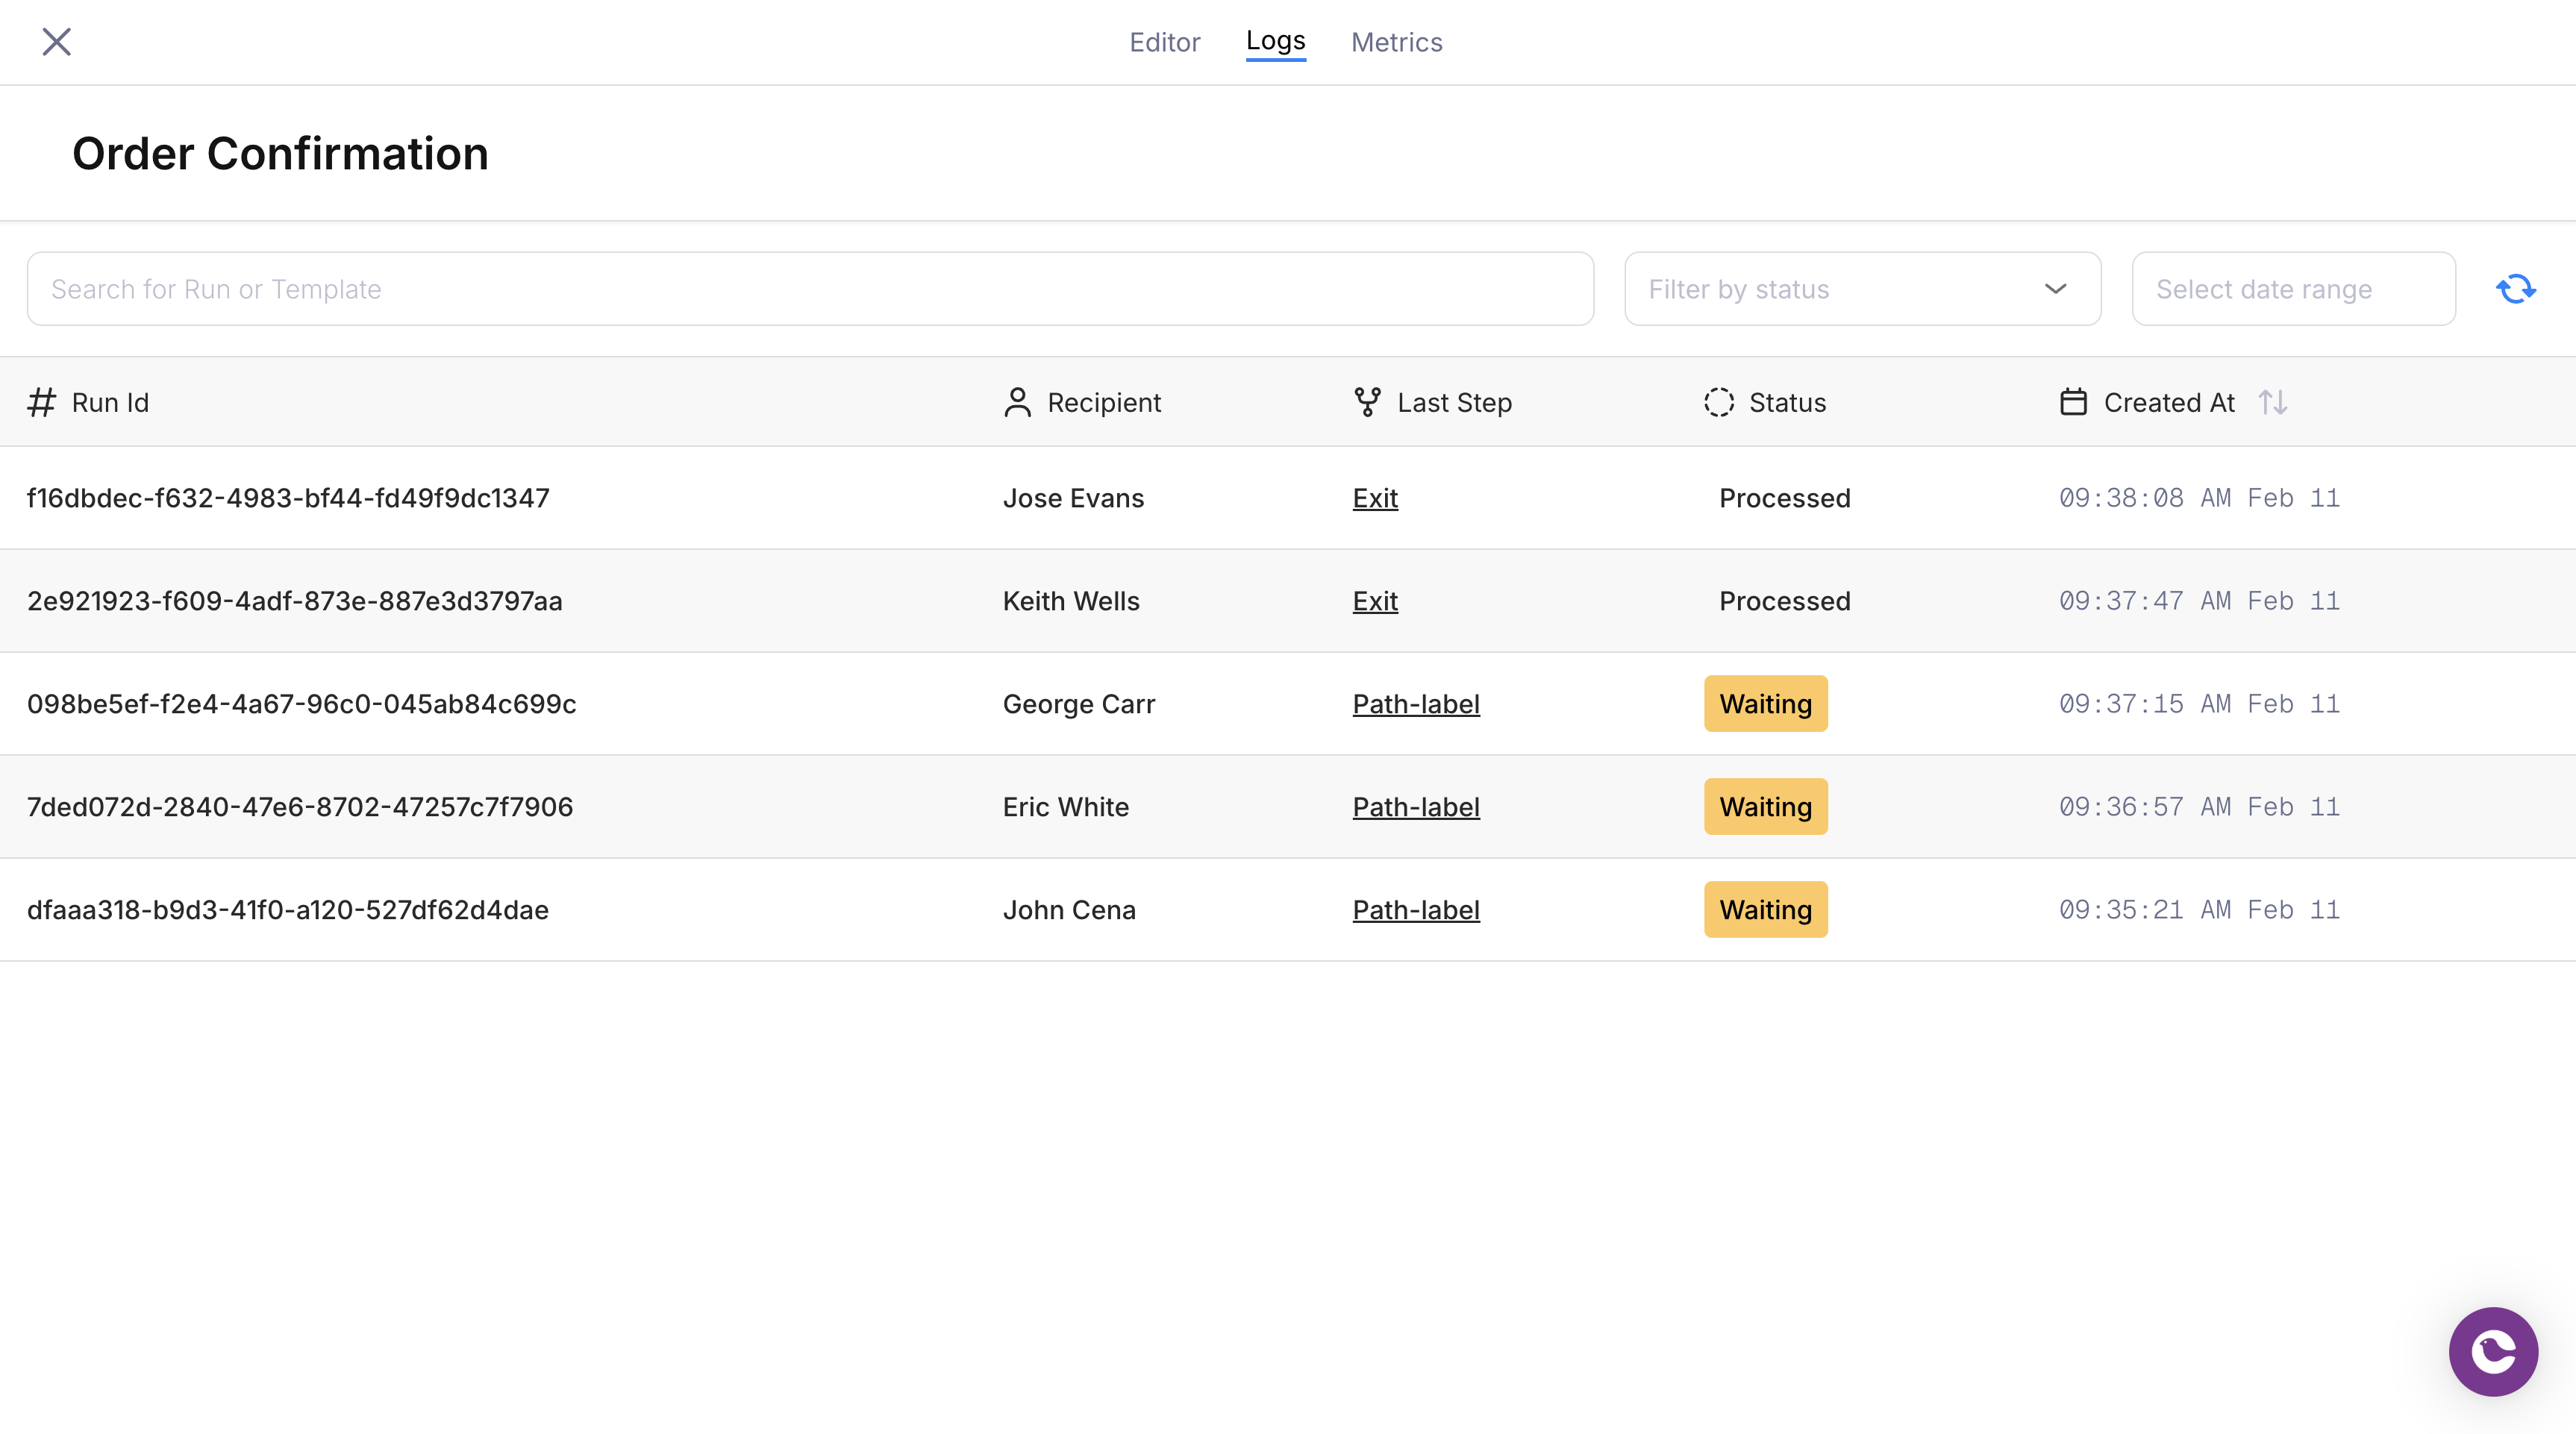
Run list showing recent journey executions with status, recipient, and timestamp
Finding a Run
The run list shows every execution of the current journey, sorted by most recent. You can narrow results with:- Search — Find runs by run ID or template ID
- Status filter — Show only runs in a specific state
- Date range — Limit to a specific time window
- Recipient — Filter by the user who entered the journey
Click any run to open the detail view.
Run Detail View
The detail view overlays execution status onto the journey graph. You see the same canvas you designed in the editor, but each node is annotated with its execution outcome for this specific run.
Run detail view with execution status overlaid on the journey graph
- Which nodes executed and in what order
- Which branch path was taken at each decision point
- Where the run is currently paused (if still in progress)
- Which node failed (if the run errored)
Step Context
Click any node in the run detail view to inspect the data context at that point in the execution. The step context viewer shows:- Input data — The payload available to this node when it executed
- Profile data — The user’s profile as it existed at this step
- Conditions evaluated — For branch and conditional nodes, which conditions were checked and whether they passed
- Output — For fetch nodes, the response data; for send nodes, the delivery status

Step context viewer showing the data payload and conditions evaluated at a branch node
data.plan which was free, not pro”) or why a send failed (“the email field was empty in the profile”).
Version Matching
When you inspect a run, Courier displays the journey version that was active when the run started. If you’ve published changes since the run executed, the detail view shows the historical version, not the current draft. This ensures you see exactly what the user experienced.Accessing Run Inspection
There are two ways to reach run inspection:- From a journey — Open a journey and click the Logs tab. This shows runs for that specific journey.
- From the global logs page — Navigate to the Journeys logs page to see runs across all journeys, with an additional template ID column for identification.