Notification Observability: How to Monitor Delivery, Engagement, and Provider Health

Kyle Seyler
January 15, 2026

Notification Observability: How to Monitor Delivery, Engagement, and Provider Health
TL;DR: Your notifications deserve the same monitoring discipline as your APIs. This guide covers what metrics to track, how to build dashboards, DIY approaches with webhooks, and platform options (including Courier's Datadog integration) for teams who want this solved out of the box.
What Is Notification Observability?
Notification observability is the practice of monitoring notification delivery, engagement, and provider health using the same tools and discipline you apply to the rest of your application infrastructure.
It means tracking whether messages are delivered, opened, and acted on across email, SMS, push, and in-app channels, then surfacing that data in dashboards alongside your other application metrics.
Most teams monitor their APIs, databases, and infrastructure obsessively, but treat notifications as fire-and-forget. Send the request, assume it worked, move on. That gap creates blind spots: emails landing in spam folders, SMS messages failing silently, push notifications rejected by providers you didn't know were degraded.
Notification observability closes that gap. Instead of discovering delivery failures from customer complaints, you catch them in Datadog or your monitoring platform of choice, the same way you'd catch elevated API error rates or database latency.
Observability for notifications means being able to answer certain questions quickly: Are messages being delivered? Are they being opened and acted on? Which providers are performing well, and which are degrading? Are we hitting rate limits? Did that template change help or hurt engagement? Is something broken right now that we don't know about?
Most teams can't answer these without logging into three different dashboards, exporting CSVs, and doing manual analysis. That's not observability. That's archaeology.
Real observability means metrics flowing into your existing monitoring stack, dashboards that show health at a glance, and alerts that fire before customers complain. If you're already using Datadog or a similar platform for your application monitoring, notification metrics should live there too.
📊 Already using Datadog? Courier's Datadog integration sends notification metrics directly to your existing dashboards. No webhook infrastructure required.
The Metrics That Matter
Not all notification data is equally useful. The temptation is to track everything, but that creates noise. Focus on metrics that actually change how you operate.
Delivery Metrics
Delivery rate by channel is the most fundamental metric, and it needs to be tracked separately for email, SMS, and push because each has different failure modes. Email might fail due to reputation issues. SMS might fail due to carrier filtering. Push might fail because users revoked permissions. A single aggregate number hides these distinctions.
Bounce and failure rates tell different stories depending on their type. Hard bounces mean invalid addresses, and a sudden spike usually indicates a list hygiene problem or a data migration gone wrong. Soft bounces are temporary failures, often from full inboxes or server issues, and typically resolve themselves. Tracking the ratio between them helps you understand whether you have a data quality problem or an infrastructure problem.
Provider latency matters more than most teams realize. The time between your send request and the provider confirming delivery directly impacts user experience. A password reset that takes 30 seconds to arrive feels broken even if it technically succeeds. Slow providers also complicate retry logic and can mask upstream issues.
Rate limit hits are worth monitoring even if you're not currently constrained. Traffic patterns change. A feature launch or marketing campaign can suddenly push you against limits you've never hit before. Knowing you're at 80% of your rate limit is more useful than discovering you're at 100% during an incident.
Engagement Metrics
Open rates are more valuable as a trend than as an absolute number. The percentage itself varies wildly by message type and audience. But if your password reset emails have maintained a 70% open rate for six months and suddenly drop to 40%, something changed. Declining open rates often signal deliverability problems before bounce rates spike, because messages landing in spam folders still count as "delivered."
Click-through rates by template turn notification data into product data. Which messages drive action? Which get ignored? A welcome email with a 2% click rate on your onboarding CTA is telling you something about your onboarding flow, not just your email performance.
Time to engagement helps you understand urgency and timing. If users typically open your appointment reminders within 5 minutes, sending them 24 hours in advance might be too early. This metric bridges operations and product thinking.
System Health Metrics
Send volume anomalies are often the earliest warning sign that something is wrong upstream. If your daily notification count suddenly doubles, maybe a feature flag flipped unexpectedly or a loop is running away. If it drops by half, maybe your event pipeline broke. These anomalies are easy to catch with basic threshold alerting.
Error rates by provider let you detect incidents before checking status pages. When Twilio has degraded performance in a specific region, your metrics will show it. This is especially useful if you have fallback routing configured, since you want to know when your primary provider is struggling even if messages are still getting delivered via backup.
Three Ways to Build Notification Observability
There's no single right approach here. The best choice depends on your volume, your engineering capacity, and how much you want to own versus outsource.
| Approach | Best For | Main Tradeoff |
|---|---|---|
| DIY with Webhooks | Teams with strong infra skills and 1-2 providers | You're building and maintaining webhook infrastructure |
| Log Aggregation | Teams who need send-side visibility quickly | No delivery confirmation or engagement data |
| Notification Platform | Multi-channel teams with limited bandwidth | Adds a vendor dependency |
DIY with Webhooks
Most notification providers support webhooks for delivery events. SendGrid, Twilio, Mailgun, Postmark—they'll all POST to your endpoint when messages are delivered, bounced, opened, or clicked. You can pipe these events into your metrics system and build dashboards from there.
The approach is straightforward: set up webhook endpoints for each provider, parse incoming events, transform them into a consistent schema, and forward to whatever metrics platform you're using. Datadog, Prometheus, Grafana—any of them work.
This gives you full control. You decide the data schema, retention policy, and exactly which metrics matter. No vendor dependency beyond the providers you're already using.
The downside is maintenance. Each provider has different event formats, different retry behavior, different quirks. Correlating data across providers requires custom code. And you're now responsible for webhook infrastructure that needs to be reliable, because missed events mean gaps in your data.
This approach makes sense for smaller teams with one or two providers and existing webhook infrastructure. If you're already running event-driven systems, adding notification webhooks isn't a huge lift.
Log Aggregation
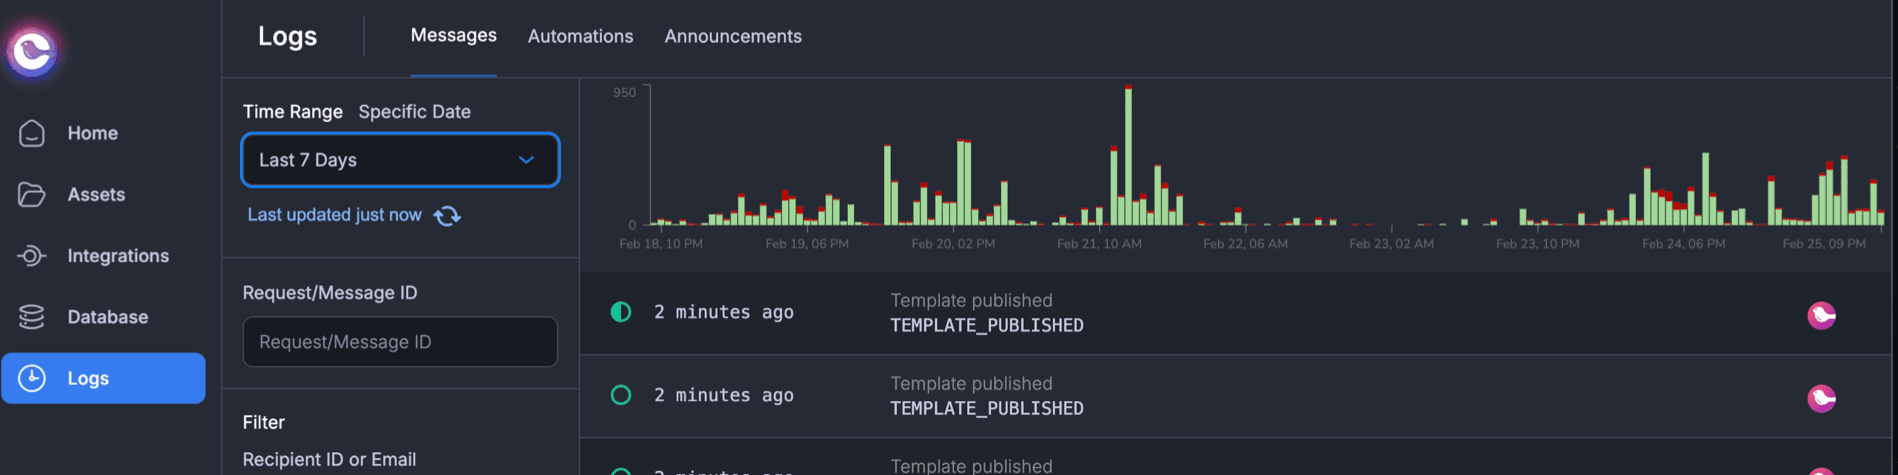
If you're already shipping application logs to a central system like Datadog Logs or Elasticsearch, you can extract notification metrics from your own send logs without any webhook infrastructure.
The idea is to add structured logging to every notification send: channel, provider, recipient identifier, template, status. Then build metrics from log queries. Your log aggregation platform becomes your notification dashboard.
This approach gets you send-side visibility quickly using infrastructure you already have. You also get full application context—user IDs, feature flags, request traces—because the logs live alongside everything else.
The limitation is that you only see what your application knows. Your logs capture that you sent a request to SendGrid, but not whether the email actually landed in the inbox. Without provider webhooks, you won't have delivery confirmation, bounce data, or engagement metrics like opens and clicks.
This works for teams who need basic visibility into notification sends but don't require delivery confirmation. It's also a reasonable first step before investing in more sophisticated monitoring.
Notification Platform with Built-in Observability
Platforms like Courier, Knock, and SuprSend aggregate data from all your providers and expose it through integrations or APIs. Instead of building webhook handlers for each provider, you get standardized metrics across all channels and providers out of the box.
The setup is typically straightforward: enable the observability integration (Datadog, New Relic, whatever you're using), import a pre-built dashboard, and metrics start flowing. No webhook infrastructure to maintain, no schema mapping, no correlation logic.
The tradeoff is vendor dependency. You're adding another system to your stack, and your notification observability is now tied to that platform. Cost scales with volume. And you're limited to whatever metrics the platform chooses to expose.
This approach makes sense for teams using multiple channels and providers, especially if you don't have engineering bandwidth to build and maintain webhook infrastructure. The value increases as complexity increases—if you're routing across email, SMS, push, and in-app with multiple providers and fallback logic, the correlation a platform provides becomes genuinely useful.
🔧 Evaluating notification platforms? Our notification infrastructure comparison breaks down Courier, Knock, Novu, and others on developer experience, channel support, and enterprise features.
Setting Up Datadog for Notification Monitoring
Datadog has become the default observability platform for cloud-native teams, so it's worth covering what notification monitoring looks like there specifically.
The DIY Approach
If you're building this yourself, the pattern is to create webhook endpoints that receive provider callbacks, parse events, and emit custom metrics via Datadog's API or DogStatsD.
A reasonable naming convention is notifications.{event} with tags for channel, provider, and template. So you'd emit notifications.delivered with tags like channel:email, provider:sendgrid, and template:password_reset. This lets you slice the data however you need in dashboards.
The code is simple. After parsing a webhook payload:
from datadog import statsdstatsd.increment('notifications.delivered',tags=['channel:email', 'provider:sendgrid', 'template:password_reset'])
Do this consistently across providers and you'll have a unified view of notification health. The work is in building reliable webhook endpoints and mapping each provider's event format to your schema.
Courier's Datadog Integration
If you're routing notifications through Courier, the integration handles metric emission automatically. You add your Datadog API key in Courier's settings, verify the site parameter matches your Datadog instance, and optionally import a pre-built dashboard.
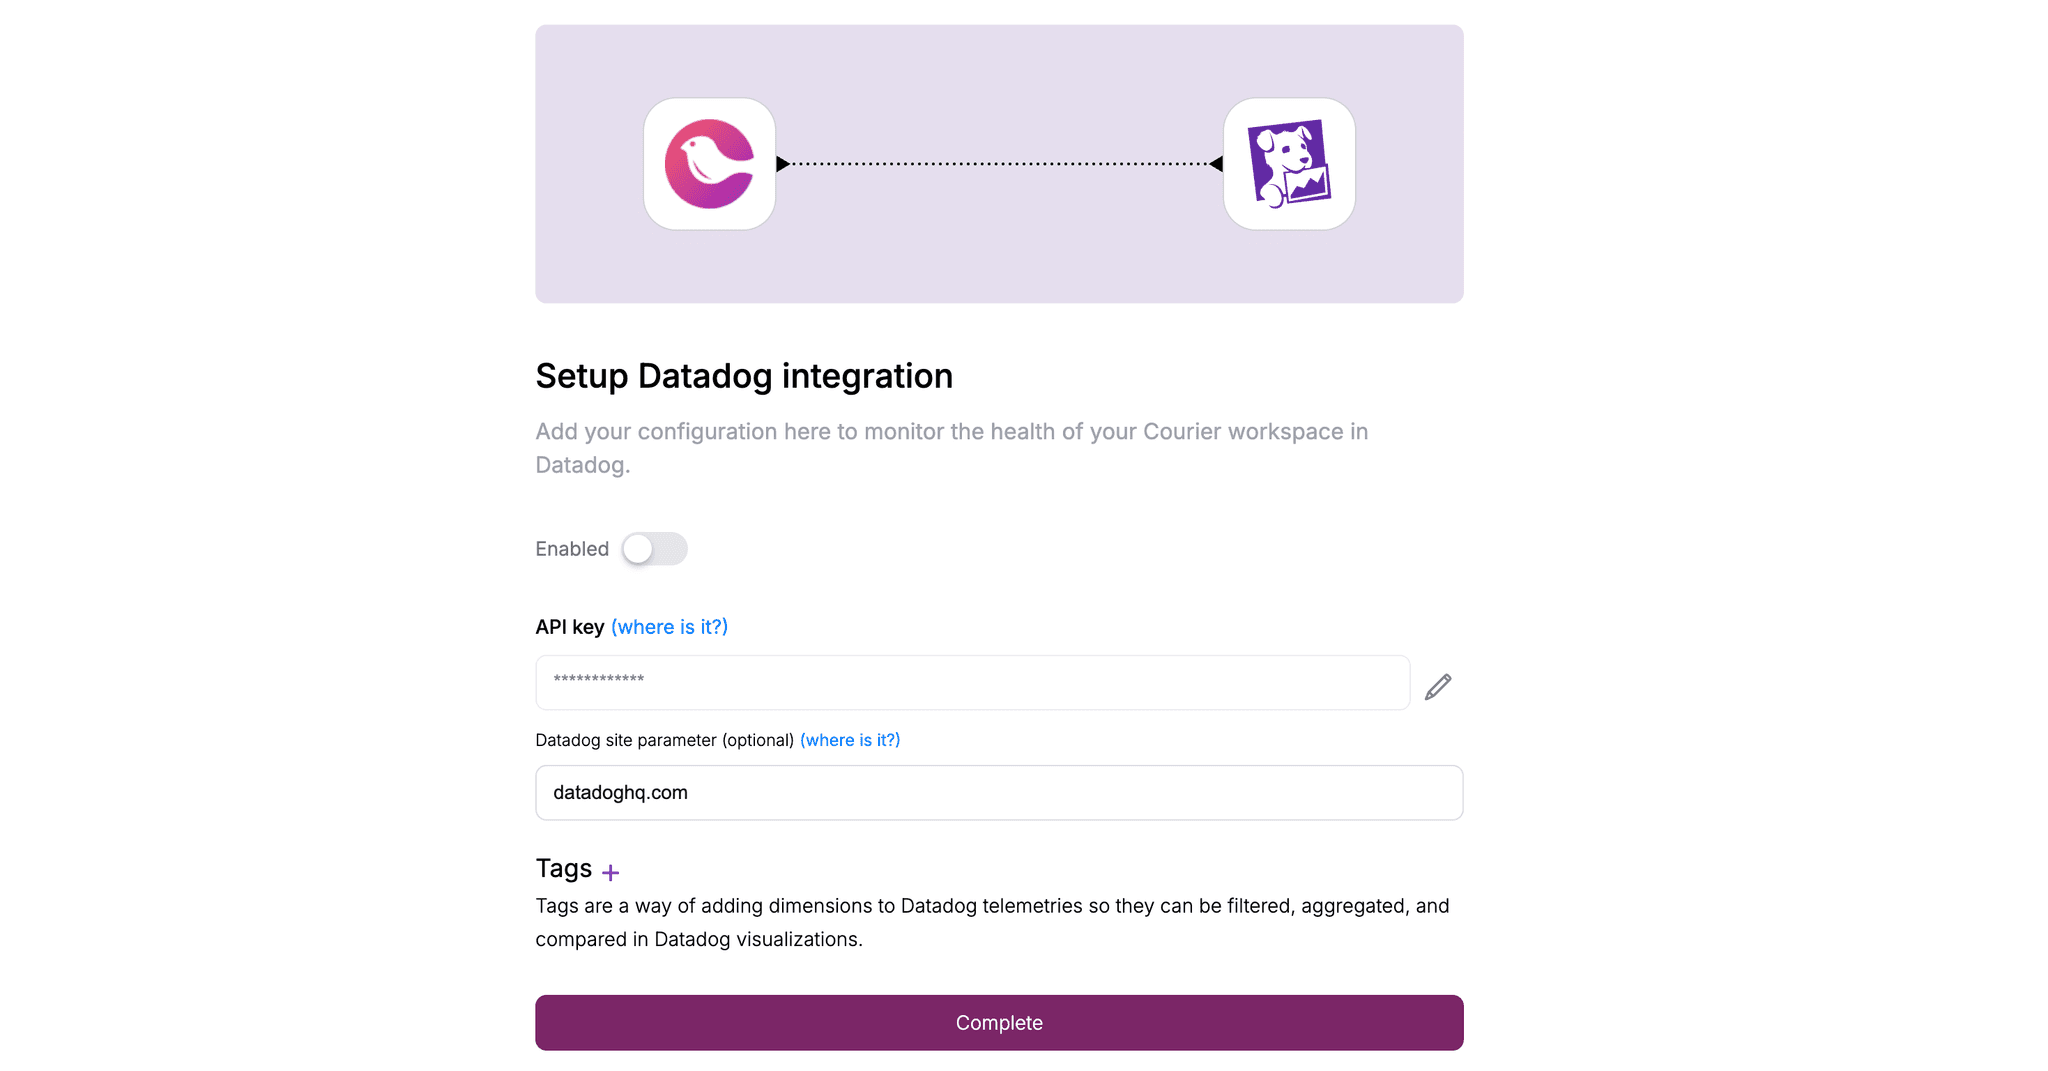
Courier metrics use a courier.* prefix, so they're easy to find and filter. You get delivery metrics across all channels, engagement data like opens and clicks, automation invocation counts if you're using Courier's workflow features, and in-app inbox connection stats.
This is available on Courier's Business plan, along with other observability integrations like New Relic.
Building a Useful Dashboard
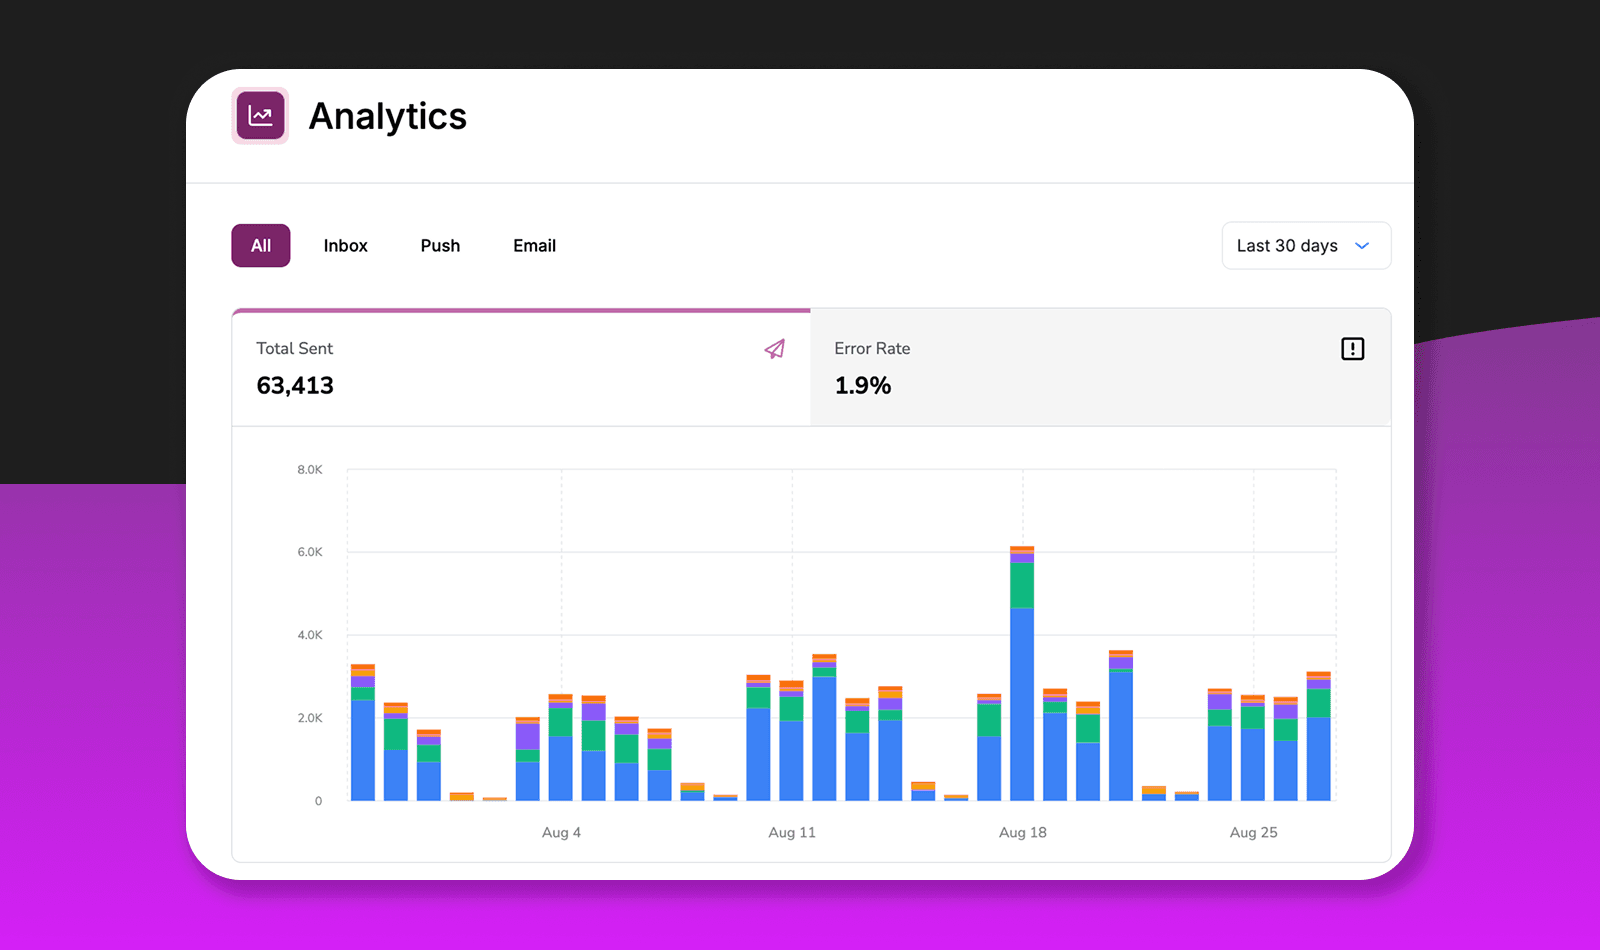
A notification dashboard should answer "is everything healthy?" at a glance. The goal isn't to show every possible metric—it's to surface problems quickly and provide enough context to start investigating.
The top of the dashboard should show key health indicators: overall delivery rate for the last 24 hours, current error rate trend, and any active alerts. These are the numbers you glance at to decide if something needs attention.
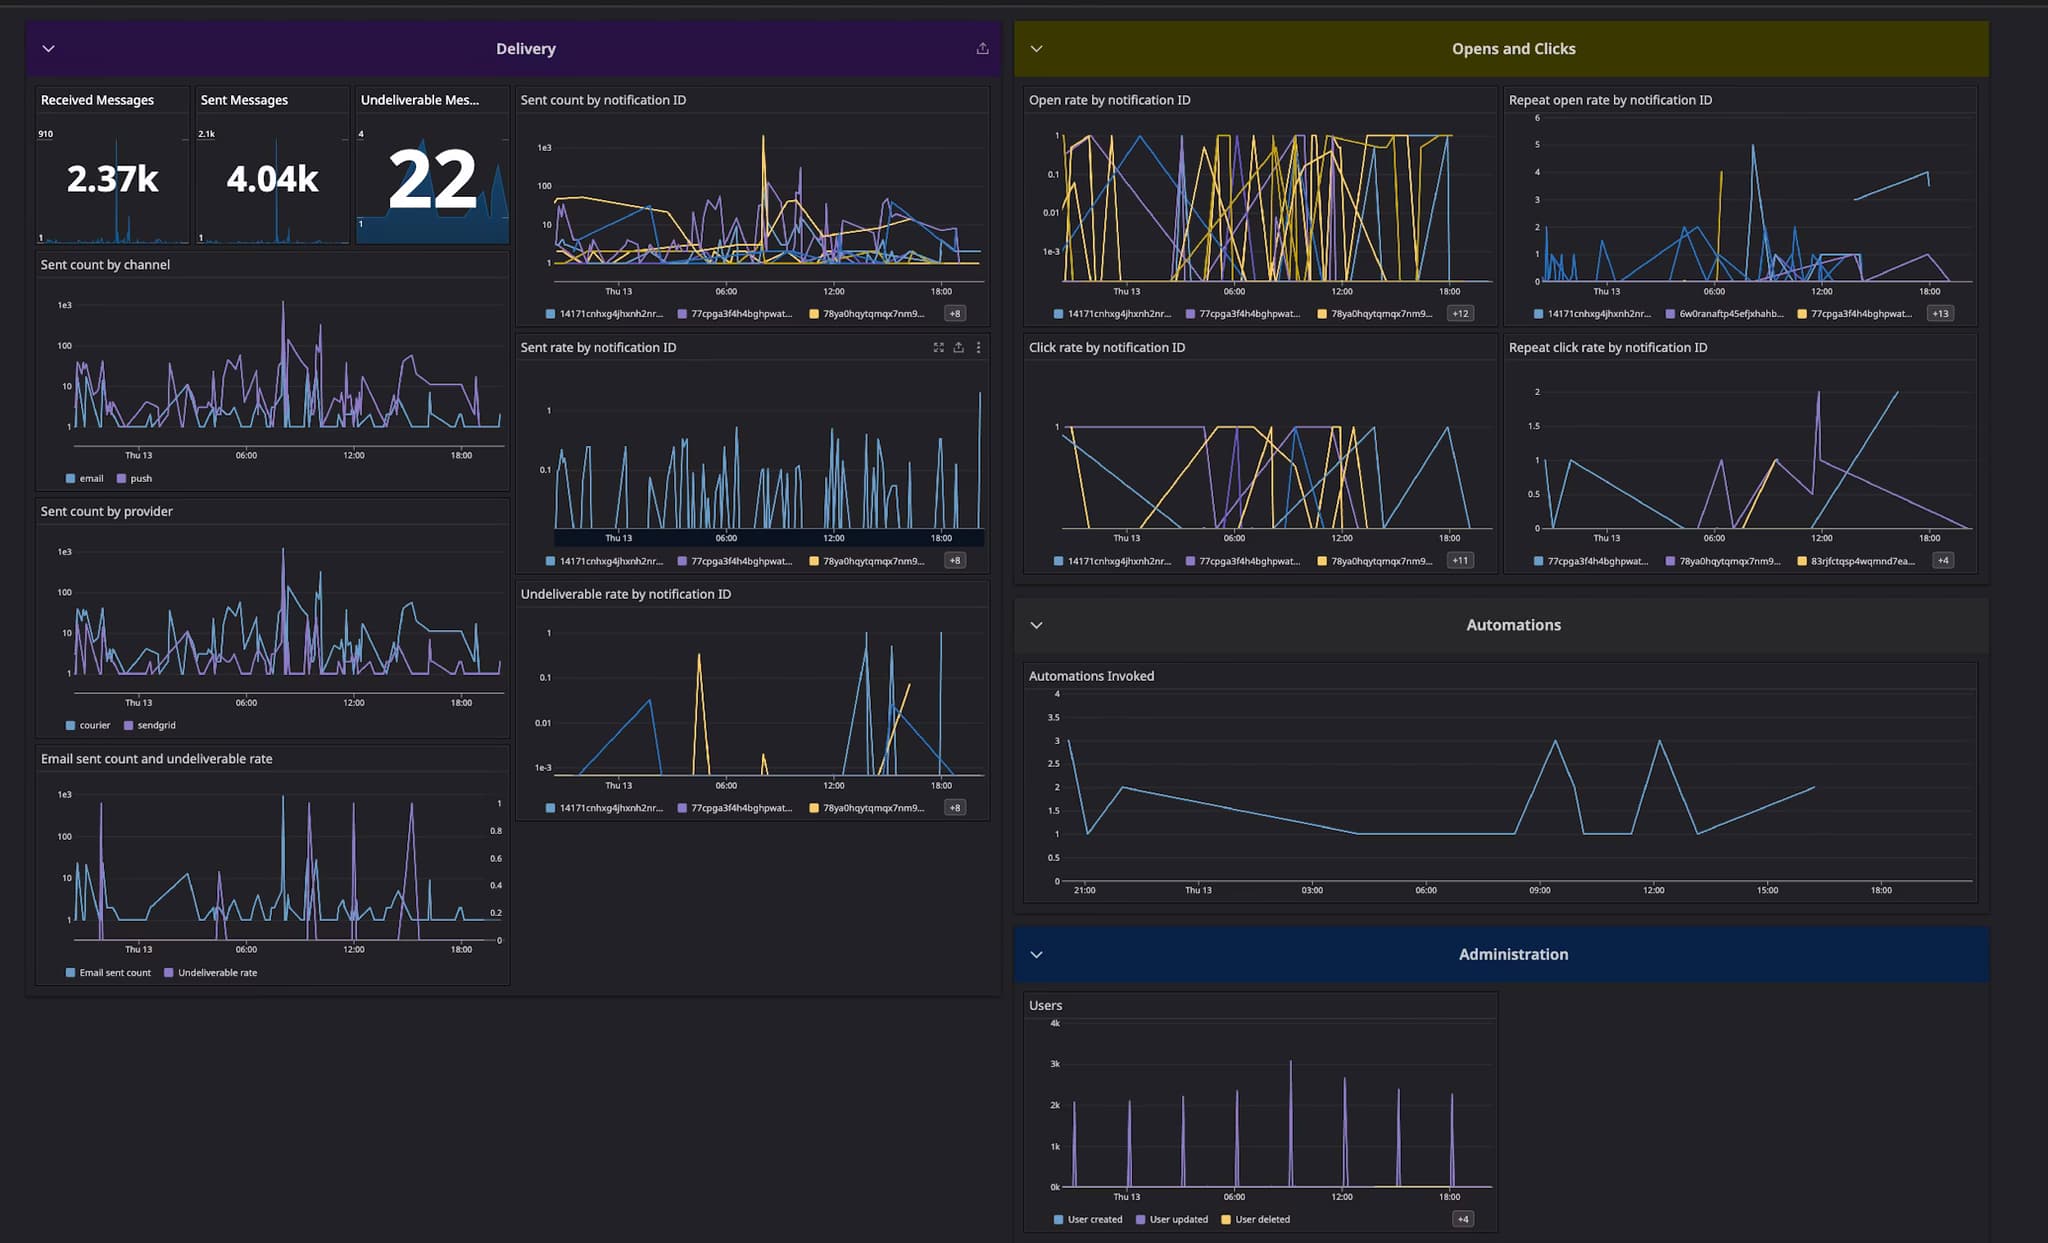
Below that, break down delivery by channel. Email, SMS, push, and in-app all have different baseline performance and different failure modes. A dashboard that blends them together hides useful signal. Show delivery rate and volume for each channel separately, ideally with a time series so you can spot trends.
Provider performance deserves its own section, especially if you use multiple providers or have fallback routing. Show delivery latency by provider, error rates, and any rate limit warnings. When one provider degrades, this section should make it obvious.
Engagement metrics round out the picture. Email open rate trends, click rates for key templates, and in-app notification read rates all help you understand whether messages are working, not just arriving.
For alerting, start simple. Alert when delivery rate drops below 95%, when error rate exceeds 2%, when provider latency exceeds a threshold like 5 seconds, or when volume deviates significantly from normal. You can tune these thresholds as you learn what's normal for your system.
When You Don't Need This
Not every team needs sophisticated notification observability. If you're sending low volumes—under 10,000 messages per month—manual monitoring is probably fine. If you use a single channel and a single provider, the provider's built-in dashboard might be sufficient. If notifications aren't business-critical, investing in observability infrastructure is premature optimization.
Start simple. Check your provider dashboards periodically. Set up basic alerts on error rates if your provider supports it. Add more sophisticated monitoring when notification failures start costing you customers or engineering time, not before.
When You Definitely Do
There are situations where notification observability becomes essential rather than nice-to-have.
Multi-channel systems are the clearest case. When you're sending email, SMS, push, and in-app notifications, problems can hide in the gaps between provider dashboards. A unified view becomes necessary to understand overall health.
Multiple providers create similar complexity. If you're running primary and fallback routing, or using different providers for different regions, you need a way to compare performance and detect when to shift traffic.
Business-critical notifications demand monitoring. Password resets, payment confirmations, security alerts, compliance notifications—these can't fail silently. If a message not arriving causes real harm to users or the business, you need to know immediately when something breaks.
Past incidents are a strong signal. If you've had an outage or degradation caused by notification failures that you discovered late, that's a sign your current visibility is insufficient.
Compliance requirements sometimes mandate delivery audit trails. Healthcare, finance, and other regulated industries often need to prove that certain messages were sent and delivered. Observability infrastructure can serve this purpose alongside operational monitoring.
And finally, scale changes everything. Systems that work fine at low volume often break in subtle ways as traffic increases. Observability helps you catch these problems before they become incidents.
Get Started
If you're building DIY: Standardize your metric naming early. Datadog's custom metrics docs cover best practices for naming conventions and tagging.
If you're evaluating notification platforms: Look for built-in observability integrations, not just provider dashboards. Our platform comparison guide breaks down options.
If you're using Courier: The Datadog integration is available on Business plan. Read the setup docs, or request a demo for a walkthrough.
Not sure where to start? Sign up free and send up to 10,000 notifications per month at no cost.
Similar resources
Push Notifications vs In-App Messages: Key Differences and When to Use Each
Push notifications reach users outside your app; in-app messages engage them inside it. Learn the key differences, when to use each, and how to run push, in-app inbox, email, and SMS from one Courier API.

Best in-app notification centers in 2026
A developer-focused comparison of the best in-app notification centers in 2026. We cover build vs buy, then compare prebuilt UI components, real-time delivery, platform coverage, channel support, and pricing across Courier Inbox, Novu, MagicBell, Liveblocks, Braze, CleverTap, Airship, OneSignal, and Customer.io.

Top 10 push notification providers in 2026
Comparing Courier, Firebase Cloud Messaging, Apple Push Notification service, Amazon SNS, OneSignal, Expo, Airship, Braze, CleverTap, and Pushwoosh on platform reach, reliability, developer experience, and pricing, each checked against its own documentation.
© 2026 Courier. All rights reserved.